WTI Price Forecast: Bearish technical setup keeps WTI capped below $60.00
- WTI remains under pressure as oversupply concerns continue to weigh on market sentiment.
- The technical setup stays tilted to the downside, as prices remain below key moving averages after repeated failures near $60.00.
- Momentum indicators reinforce the bearish bias, suggesting sellers remain in control.

West Texas Intermediate (WTI) Crude Oil remains under pressure on Friday, with prices struggling to find traction as persistent oversupply concerns continue to dominate market sentiment. At the time of writing, WTI is trading around $57.10, hovering near recent lows and on track to post a weekly decline of more than 4%.
The broader tone in the oil market remains cautious as investors focus on signs that global supply continues to outpace demand. Geopolitical developments are also shaping sentiment. Markets remain attentive to Russia-Ukraine peace-talk optimism, with traders viewing any meaningful progress toward a deal as a potential pathway for additional Russian crude to return to global markets.
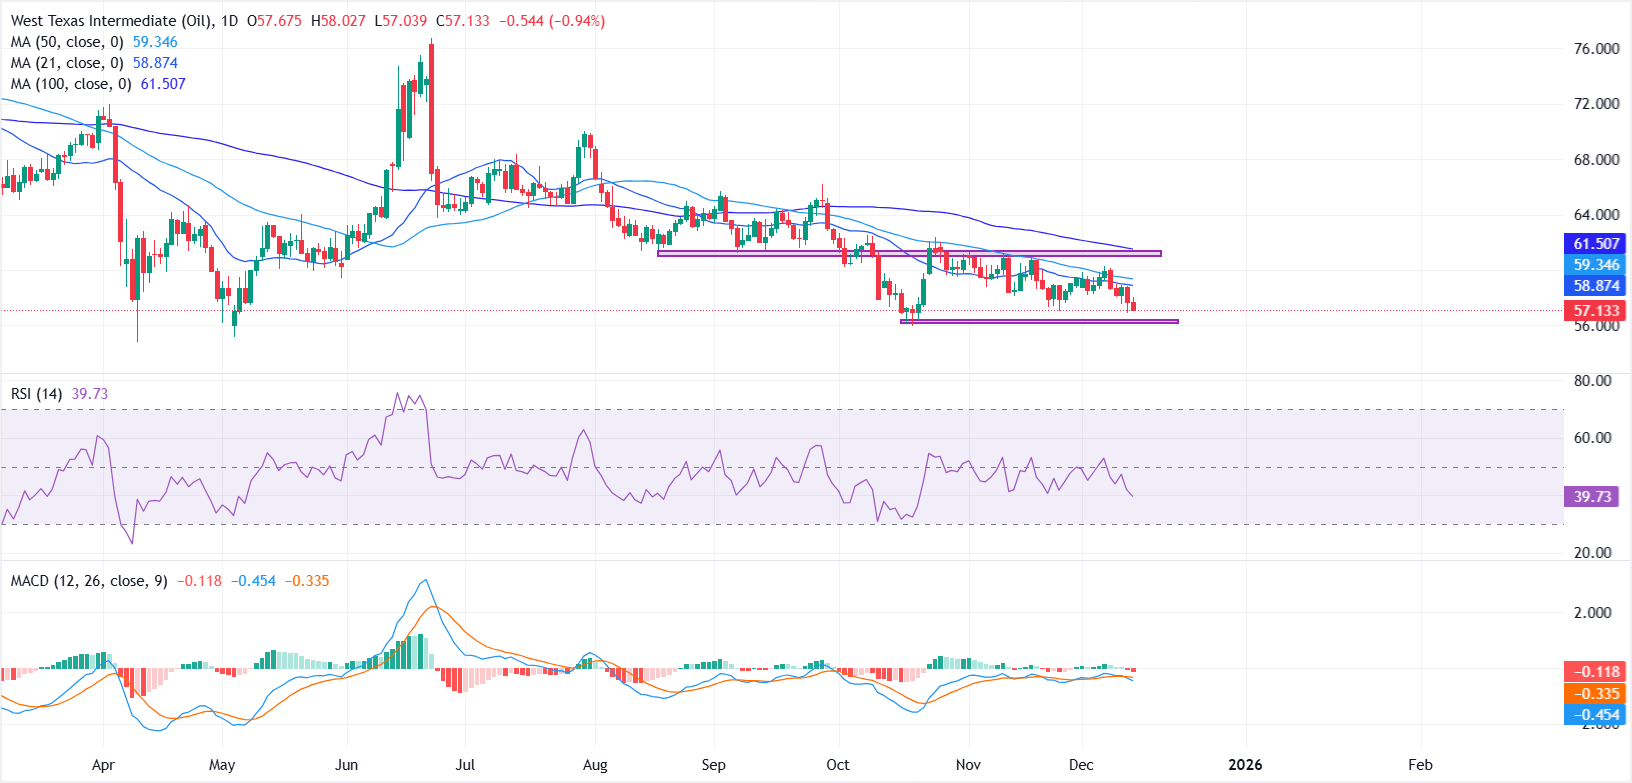
From a technical perspective, WTI’s broader outlook remains bearish, with prices facing repeated rejections near the $60.00 psychological level. The daily chart shows prices trading below their key moving averages, underscoring the prevailing downside bias and suggesting that seller remains firmly in control.
On the downside, immediate support is located in the $56.50-$56.00 zone, which marks the October swing low. A daily close below this area would reinforce the bearish trend and open the door for deeper losses toward the year’s low near $54.80.
On the upside, overhead resistance from the descending moving averages continues to cap recovery attempts, with any rebound likely to face selling interest ahead of the $60.00 handle. Unless prices manage a sustained move back above this level, the near-term outlook remains tilted to the downside.
Momentum indicators also favour bears. The Relative Strength Index (RSI) remains below the neutral 50 mark, reflecting weak upside momentum, while the Moving Average Convergence Divergence (MACD) has slipped below its signal line and remains in negative territory, with the histogram pointing to strengthening bearish momentum.
WTI Oil FAQs
WTI Oil is a type of Crude Oil sold on international markets. The WTI stands for West Texas Intermediate, one of three major types including Brent and Dubai Crude. WTI is also referred to as “light” and “sweet” because of its relatively low gravity and sulfur content respectively. It is considered a high quality Oil that is easily refined. It is sourced in the United States and distributed via the Cushing hub, which is considered “The Pipeline Crossroads of the World”. It is a benchmark for the Oil market and WTI price is frequently quoted in the media.
Like all assets, supply and demand are the key drivers of WTI Oil price. As such, global growth can be a driver of increased demand and vice versa for weak global growth. Political instability, wars, and sanctions can disrupt supply and impact prices. The decisions of OPEC, a group of major Oil-producing countries, is another key driver of price. The value of the US Dollar influences the price of WTI Crude Oil, since Oil is predominantly traded in US Dollars, thus a weaker US Dollar can make Oil more affordable and vice versa.
The weekly Oil inventory reports published by the American Petroleum Institute (API) and the Energy Information Agency (EIA) impact the price of WTI Oil. Changes in inventories reflect fluctuating supply and demand. If the data shows a drop in inventories it can indicate increased demand, pushing up Oil price. Higher inventories can reflect increased supply, pushing down prices. API’s report is published every Tuesday and EIA’s the day after. Their results are usually similar, falling within 1% of each other 75% of the time. The EIA data is considered more reliable, since it is a government agency.
OPEC (Organization of the Petroleum Exporting Countries) is a group of 12 Oil-producing nations who collectively decide production quotas for member countries at twice-yearly meetings. Their decisions often impact WTI Oil prices. When OPEC decides to lower quotas, it can tighten supply, pushing up Oil prices. When OPEC increases production, it has the opposite effect. OPEC+ refers to an expanded group that includes ten extra non-OPEC members, the most notable of which is Russia.
Author

Vishal Chaturvedi
FXStreet
I am a macro-focused research analyst with over four years of experience covering forex and commodities market. I enjoy breaking down complex economic trends and turning them into clear, actionable insights that help traders stay ahead of the curve.

















