WTI Price Forecast: Bearish bias remains intact under 100-day EMA near $63.00
- WTI price declined to near $63.00 in Friday’s early European session.
- Negative view of the WTI prevails below the 100-day EMA, with a bearish RSI indicator.
- The initial support level is seen at $62.50; the immediate resistance level to watch is $65.00.

West Texas Intermediate (WTI), the US crude oil benchmark, is trading around $63.00 during the early European trading hours on Wednesday. The WTI drifts lower as crude inventories unexpectedly rose last week, indicating weaker demand. Additionally, a report from Reuters that OPEC+ is considering an increase in its crude production levels raises concerns over a global oil supply glut, weighing on the WTI’s downside.
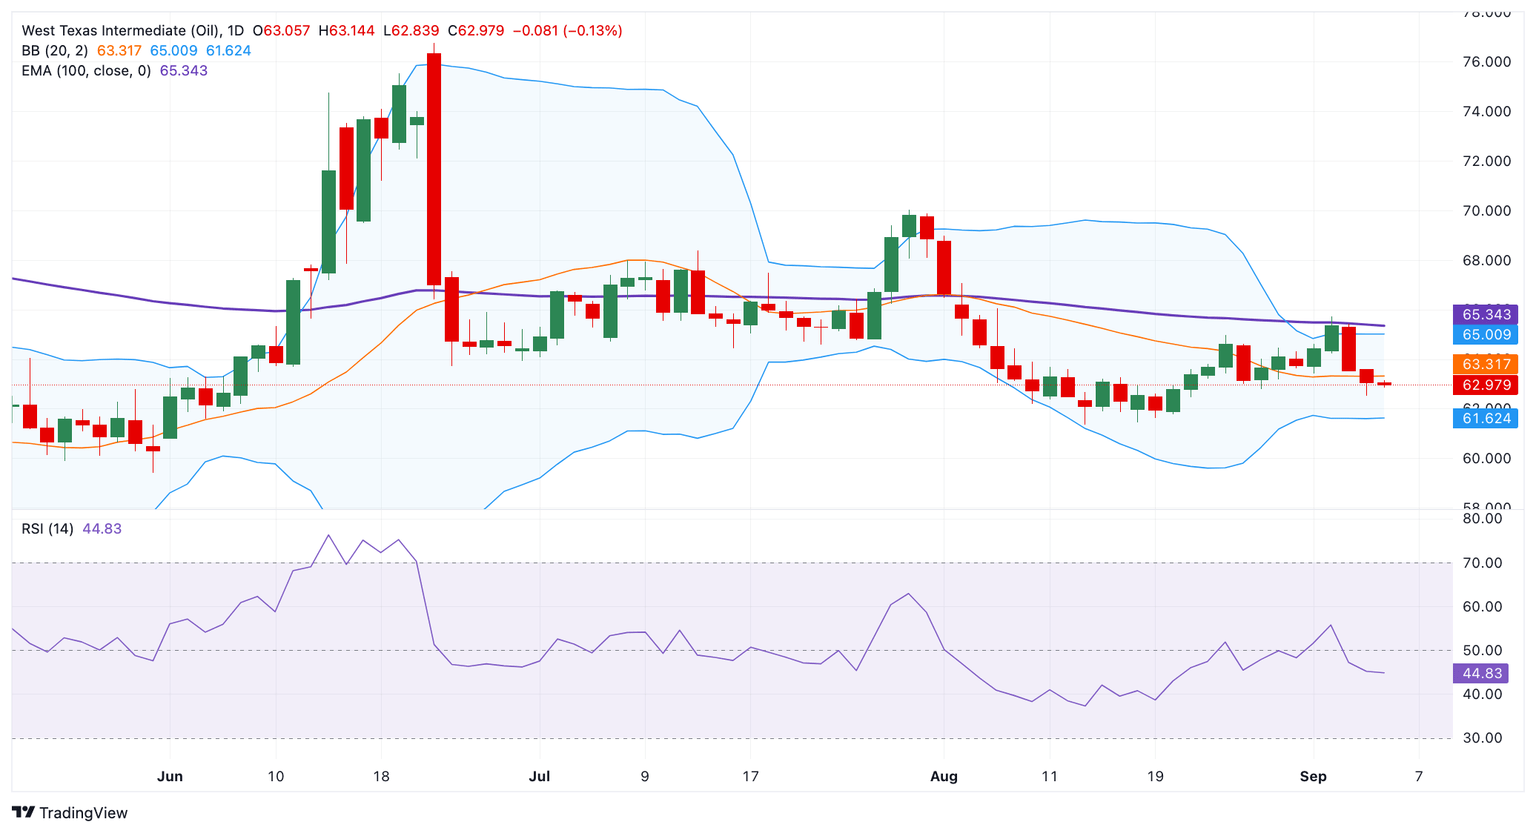
Technically, the bearish outlook of WTI remains in play as the price remains capped below the key 100-day Exponential Moving Average (EMA) on the daily chart. The path of least resistance is to the downside, with the 14-day Relative Strength Index (RSI) standing below the midline near 44.75. This suggests the bearish momentum in the near term.
The low of September at $62.50 acts as an initial support level for the black gold. A decisive break below the mentioned level could expose $61.60, the lower limit of the Bollinger Band. Further south, the crucial contention level is seen at the $60.00 psychological level.
On the bright side, the first upside barrier for WTI to watch is $65.00, the upper boundary of the Bollinger Band and the round figure. Sustained trading above this level could pave the way to $65.45, the 100-day EMA. Extended gains could see the next hurdle at $67.63, the high of July 11.
WTI daily chart
WTI Oil FAQs
WTI Oil is a type of Crude Oil sold on international markets. The WTI stands for West Texas Intermediate, one of three major types including Brent and Dubai Crude. WTI is also referred to as “light” and “sweet” because of its relatively low gravity and sulfur content respectively. It is considered a high quality Oil that is easily refined. It is sourced in the United States and distributed via the Cushing hub, which is considered “The Pipeline Crossroads of the World”. It is a benchmark for the Oil market and WTI price is frequently quoted in the media.
Like all assets, supply and demand are the key drivers of WTI Oil price. As such, global growth can be a driver of increased demand and vice versa for weak global growth. Political instability, wars, and sanctions can disrupt supply and impact prices. The decisions of OPEC, a group of major Oil-producing countries, is another key driver of price. The value of the US Dollar influences the price of WTI Crude Oil, since Oil is predominantly traded in US Dollars, thus a weaker US Dollar can make Oil more affordable and vice versa.
The weekly Oil inventory reports published by the American Petroleum Institute (API) and the Energy Information Agency (EIA) impact the price of WTI Oil. Changes in inventories reflect fluctuating supply and demand. If the data shows a drop in inventories it can indicate increased demand, pushing up Oil price. Higher inventories can reflect increased supply, pushing down prices. API’s report is published every Tuesday and EIA’s the day after. Their results are usually similar, falling within 1% of each other 75% of the time. The EIA data is considered more reliable, since it is a government agency.
OPEC (Organization of the Petroleum Exporting Countries) is a group of 12 Oil-producing nations who collectively decide production quotas for member countries at twice-yearly meetings. Their decisions often impact WTI Oil prices. When OPEC decides to lower quotas, it can tighten supply, pushing up Oil prices. When OPEC increases production, it has the opposite effect. OPEC+ refers to an expanded group that includes ten extra non-OPEC members, the most notable of which is Russia.
Author

Lallalit Srijandorn
FXStreet
Lallalit Srijandorn is a Parisian at heart. She has lived in France since 2019 and now becomes a digital entrepreneur based in Paris and Bangkok.


