WTI Price Forecast: At make or a break near $62
- The Oil price trades lower at around $62.50 ahead of the Trump-Putin meeting.
- US President Trump expressed confidence that Russia would agree to end the war in Ukraine.
- The Fed is expected to cut interest rates in the September policy meeting.

West Texas Intermediate (WTI), futures on NYMEX, trades 0.9% lower at around $62.50 during the European trading session on Friday. The Oil price faces selling pressure as comments from United States (US) President Donald Trump have signaled that Russian leader Vladimir Putin would agree to stop the war in Ukraine.
These comments from US President Trump came on Thursday, in an interview with Fox News, ahead of the meeting with Russian leader Putin in Alaska on Friday. “I think he's going to make a deal, Trump said. He added that he would then call Ukrainian President Volodymyr Zelenskiy and his European allies to schedule a meeting for further truce talks.
The Oil price has come under pressure on expectations that the US and the European Union (EU) would roll back sanctions on Russia if it agrees to end the war in Ukraine, a scenario that will increase the global Oil supply.
Additionally, a weak Oil demand outlook due to global trade risk would continue to keep the Oil price on the back foot.
Meanwhile, firm expectations that the Federal Reserve (Fed) will reduce interest rates in the September meeting, even as US Producer Price Index (PPI) data for July has come in hotter-than-projected, is the only hope of Oil price bulls.
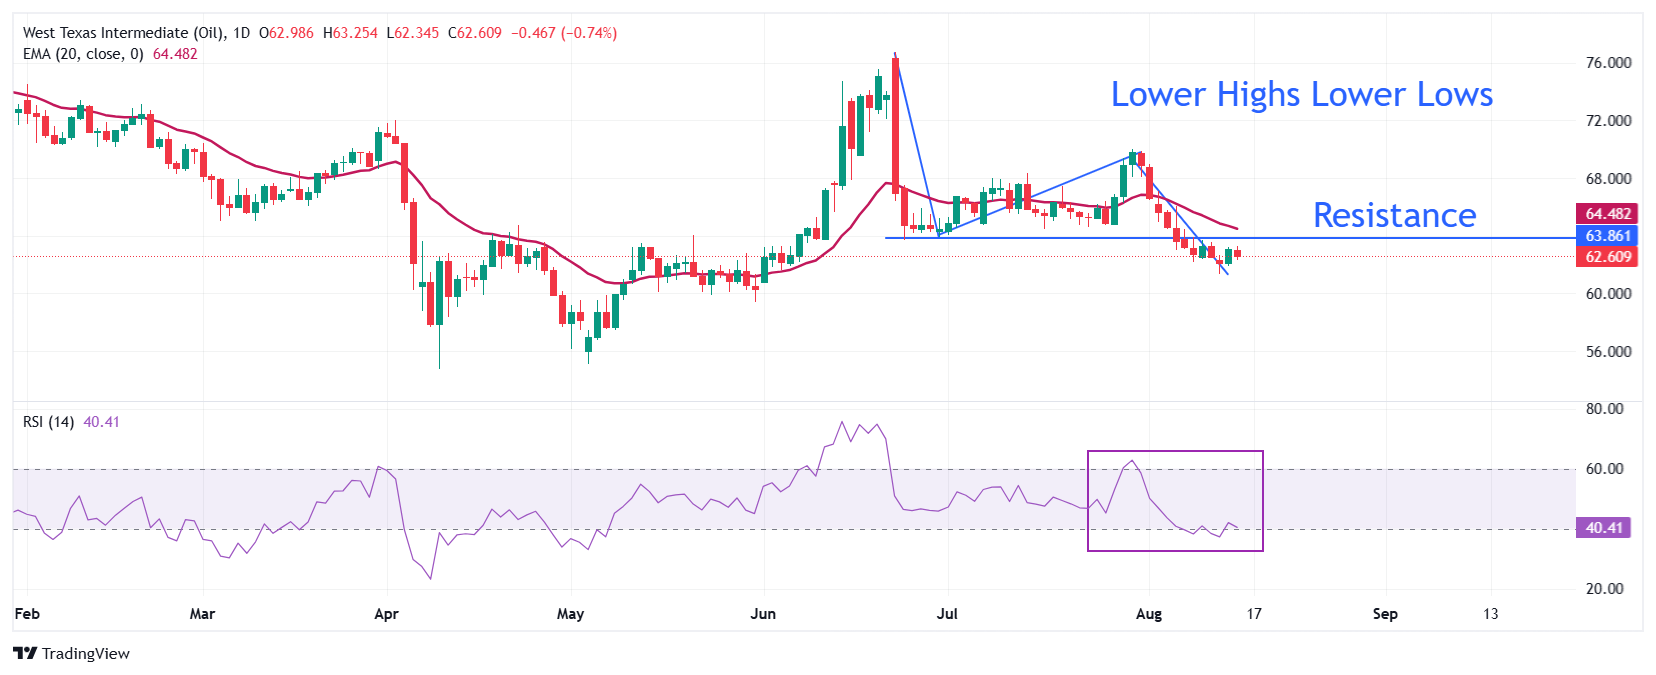
The formation of a fresh swing low by the Oil price near $61.35 on August 13 has confirmed a lower high and lower low structure, which indicates a bearish trend. The downward-sloping 20-day Exponential Moving Average (EMA) near $34.48 also suggests that the near-term trend is bearish.
The 14-day Relative Strength Index (RSI) hovers at a make-or-break level around 40.00. A fresh downside momentum would emerge if the RSI slides below that level.
The Oil price could extend its downside to near the psychological level of $60.00 and the May 30 low of $59.40 if it breaks below Wednesday’s low of $61.35.
On the flip side, a recovery move by the Oil price above the August 6 high of $66.00 would open the door towards the July 9 high of $68.00, followed by the July 30 high of $70.00.
WTI daily chart
WTI Oil FAQs
WTI Oil is a type of Crude Oil sold on international markets. The WTI stands for West Texas Intermediate, one of three major types including Brent and Dubai Crude. WTI is also referred to as “light” and “sweet” because of its relatively low gravity and sulfur content respectively. It is considered a high quality Oil that is easily refined. It is sourced in the United States and distributed via the Cushing hub, which is considered “The Pipeline Crossroads of the World”. It is a benchmark for the Oil market and WTI price is frequently quoted in the media.
Like all assets, supply and demand are the key drivers of WTI Oil price. As such, global growth can be a driver of increased demand and vice versa for weak global growth. Political instability, wars, and sanctions can disrupt supply and impact prices. The decisions of OPEC, a group of major Oil-producing countries, is another key driver of price. The value of the US Dollar influences the price of WTI Crude Oil, since Oil is predominantly traded in US Dollars, thus a weaker US Dollar can make Oil more affordable and vice versa.
The weekly Oil inventory reports published by the American Petroleum Institute (API) and the Energy Information Agency (EIA) impact the price of WTI Oil. Changes in inventories reflect fluctuating supply and demand. If the data shows a drop in inventories it can indicate increased demand, pushing up Oil price. Higher inventories can reflect increased supply, pushing down prices. API’s report is published every Tuesday and EIA’s the day after. Their results are usually similar, falling within 1% of each other 75% of the time. The EIA data is considered more reliable, since it is a government agency.
OPEC (Organization of the Petroleum Exporting Countries) is a group of 12 Oil-producing nations who collectively decide production quotas for member countries at twice-yearly meetings. Their decisions often impact WTI Oil prices. When OPEC decides to lower quotas, it can tighten supply, pushing up Oil prices. When OPEC increases production, it has the opposite effect. OPEC+ refers to an expanded group that includes ten extra non-OPEC members, the most notable of which is Russia.
Author

Sagar Dua
FXStreet
Sagar Dua is associated with the financial markets from his college days. Along with pursuing post-graduation in Commerce in 2014, he started his markets training with chart analysis.


