|

WTI Price Analysis: Wavers around one-year top amid overbought RSI

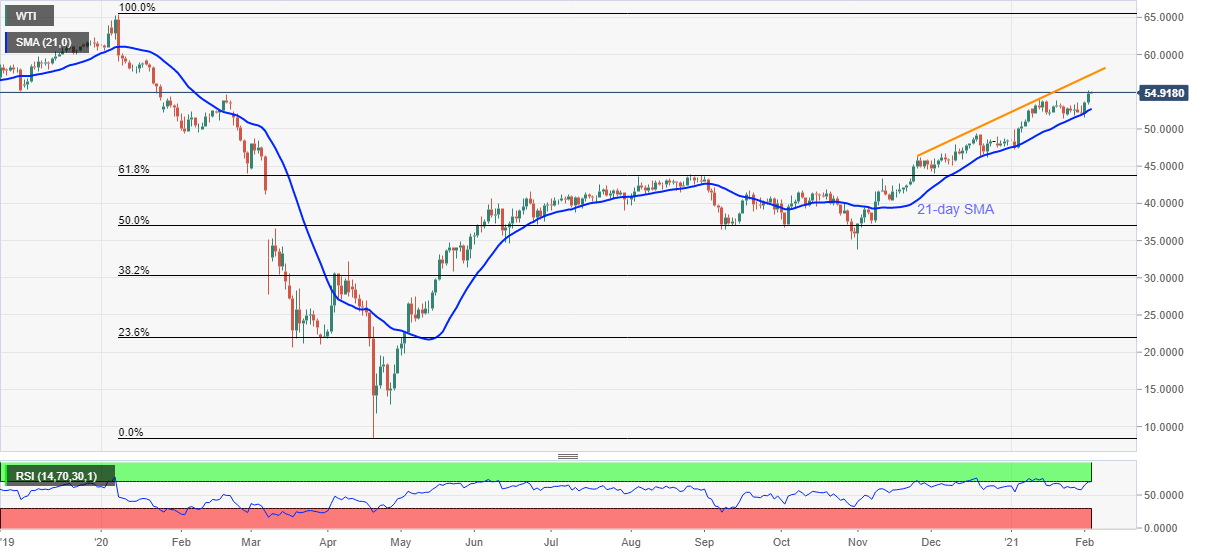
  • WTI wavers around late-January 2020 high, eases from $55.00 seems to offer immediate resistance.
  • Overbought RSI conditions can drag the quote back to February top but 21-day SMA will restrict further downside.
  • 10-week-old resistance line lures the bulls beyond $55.00.

Despite marking repeated pullback moves from $55.00, WTI remains strong near the highest since January 24, 2020, currently up 0.35% near $54.90, during early Wednesday. In doing so, the energy benchmark keeps the previous day’s upside break of February 2020 top.

Though, overbought RSI conditions raise doubt on the quote’s further advances. As a result, intraday sellers may take a risk in case the black gold prices drop below February 2020 peak surrounding $54.70.

Following that, the January’s peak surrounding $53.90 and 21-day SMA level of $52.70 will be the key levels to watch, a break of which could change the current uptrend.

On the contrary, successful trading beyond $54.70 will keep hammering the $55.00 threshold while targeting an upward sloping trend line from late November, at $57.35 now.

Should oil bulls dominate past-$57.35, $60.00 psychological magnet and the last year’s high of $65.35 should gain the market’s attention.

WTI daily chart

Trend: Pullback expected

Additional important levels

Overview
Today last price54.9
Today Daily Change0.19
Today Daily Change %0.35%
Today daily open54.71
 
Trends
Daily SMA2052.59
Daily SMA5049.3
Daily SMA10044.73
Daily SMA20041.16
 
Levels
Previous Daily High55.16
Previous Daily Low53.32
Previous Weekly High53.51
Previous Weekly Low51.8
Previous Monthly High53.94
Previous Monthly Low47.26
Daily Fibonacci 38.2%54.46
Daily Fibonacci 61.8%54.02
Daily Pivot Point S153.63
Daily Pivot Point S252.55
Daily Pivot Point S351.78
Daily Pivot Point R155.48
Daily Pivot Point R256.25
Daily Pivot Point R357.33

Author

Anil Panchal

Anil Panchal

FXStreet

Anil Panchal has nearly 15 years of experience in tracking financial markets. With a keen interest in macroeconomics, Anil aptly tracks global news/updates and stays well-informed about the global financial moves and their implications.

More from Anil Panchal
Share:

Editor's Picks

EUR/USD eases marginally, back to 1.1800

EUR/USD navigates a narrow range on Thursday, hovering around the 1.1800 neighbourhood in a context of humble gains in the US Dollar. The pair’s lacklustre performance come amid the unabated trade uncertainty, geopolitical tensions in the Middle East and the cautious tone from the ECB’s Lagarde.

GBP/USD retreats from tops, approaching 1.3540

GBP/USD partially sets aside Wednesday’s strong advance and recedes to the 1.3540 region on Thursday. Cable’s modest retracement follows the equally acceptable gains in the Greenback, while investors continue to pencil in a potential BoE rate cut in March.

Gold clings to gains just below $5,200, focus on geopolitics

Gold is edging modestly higher on Thursday, adding to Wednesday’s uptick and holding just below the $5,200 mark per troy ounce against the backdrop of modest gains in the US Dollar. In the meantime, attention is turning to the geopolitical scenario following US-Iran nuclear talks.

Stellar: Relief bounce fades as bearish undertone persists

Stellar is trading around $0.16 at the time of writing on Thursday after rebounding more than 8% in the previous day. Derivatives data paints a negative picture as XLM’s short bets hit a monthly high while Open Interest continues to decline.

The one thing everyone is on the lookout for is US action of some sort against Iran

The FX market is minestrone soup these days. It is befuddled by conflicting data, rumors and small stories exaggerated out of proportion, and Trump-generated uncertainty. 

Bitcoin steadies as traders eye US–Iran talks

Bitcoin (BTC) price is stabilizing around $68,000 at the time of writing on Thursday after a 6.2% relief rally the previous day amid a broader downward trend.