WTI Price Analysis: Teasing a rising wedge breakdown on 4H chart
- The US oil resumes correction from seven-year highs of $84.97.
- WTI is on the verge of confirming a rising wedge breakdown on the 4H chart.
- 50-SMA support at $82.73 holds the key, as RSI flips bearish.

WTI (NYMEX futures) is back in the red so far this Wednesday, reversing Tuesday’s temporary reversal, as the bears look to resume the corrective decline from seven-year peaks of $84.97.
At the time of writing, the US oil is trading at $83.13, down about 1% on the day, heading towards the next critical support of the upward-sloping 50-Simple Moving Average (SMA) on the four-hour chart at $82.73.
The overnight weakness is extending into the European session, as WTI breached the 21-SMA cap at $83.47.
The black gold now teases a rising wedge breakdown on the said time frame, with a four-hourly candlestick closing below the rising trendline support at $83.23 needed to confirm the downside breakout.
Should the bears succeed, the immediate support is seen at 50-SMA, below which the $81 round figure could be tested.
The next fierce support awaits at the October 21 lows of $80.06.
The Relative Strength Index (RSI) has pierced through the midline, flipping into the bearish zone, suggesting that the further downside remains on the cards.
WTI: Four-hour chart
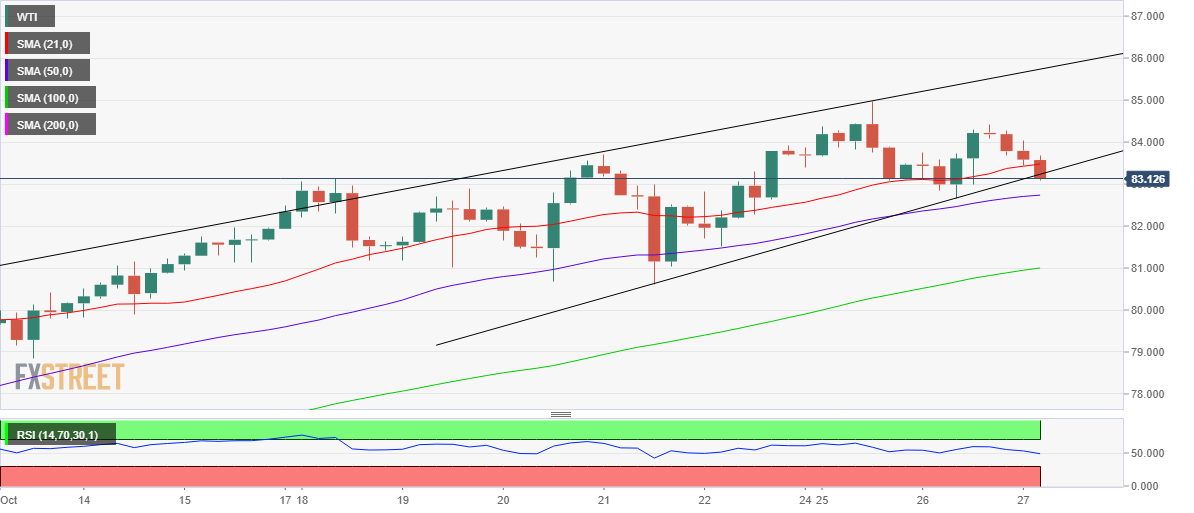
On the flip side, any recovery attempt will meet the initial hurdle at the 21-SMA, the previous support now resistance.
The buyers will then look for fresh entries towards $84.42, October 26 highs. Further up, the upswing could extend towards multi-year tops of $84.97.
WTI: Additional levels to watch
Author

Dhwani Mehta
FXStreet
Residing in Mumbai (India), Dhwani is a Senior Analyst and Manager of the Asian session at FXStreet. She has over 10 years of experience in analyzing and covering the global financial markets, with specialization in Forex and commodities markets.


