|

WTI Price Analysis: Steadies above $113.00, six-week-old resistance line in focus

  • WTI remains sidelined after rising the most in a fortnight.
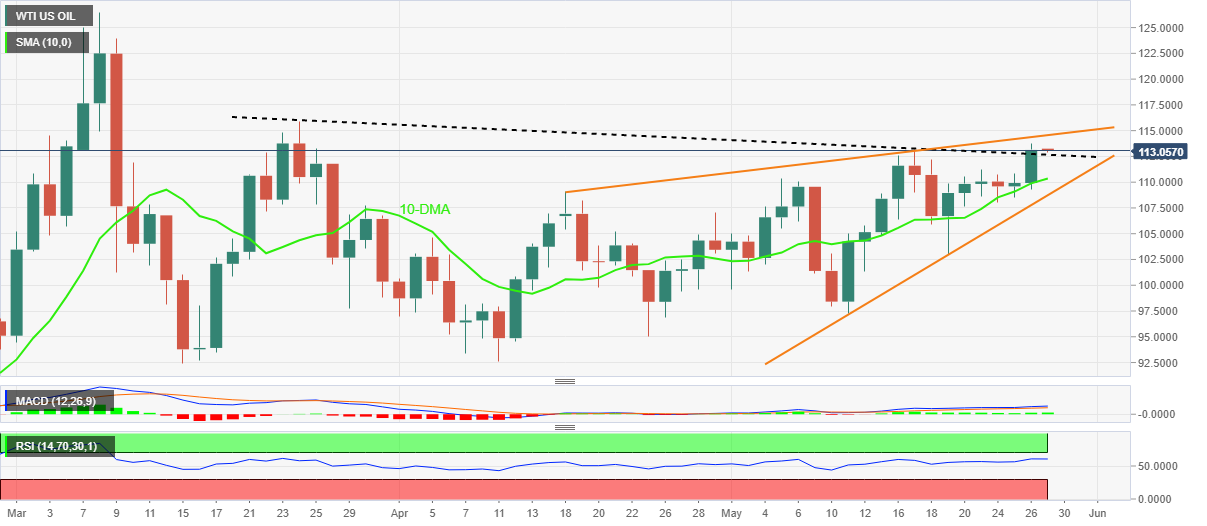
  • Break of two-month-old descending trend line, bullish MACD signals favor buyers.
  • Rising wedge can test buyers on the way to late March swing high.

WTI struggles to extend the upside break of the key hurdle, grinds higher around the two-month top during Friday’s Asian session. That said, the black gold seesaws near $113.10 at the latest.

Given the firmer RSI (14), not overbought, joining the bullish MACD signals to back WTI’s latest breakout, the commodity prices are likely to extend the run-up.

However, a six-week-old rising wedge bearish chart pattern tests the upside momentum, with the formation’s resistance line near $114.90 acting as an immediate hurdle.

Also challenging the short-term WTI buyers is March’s high near $115.90, a break of which will allow the bulls to aim for the yearly top marked in March near $129.45.

Meanwhile, pullback moves remain elusive beyond the resistance-turned-support line from March 24, around $112.55 by the press time.

Following that, the 10-DMA and support line of the aforementioned wedge, respectively near $110.35 and $108.75, will be crucial to watch.

Should the quote drops past $108.75, it confirms the rising wedge and becomes vulnerable to testing April’s low near $92.65.

WTI: Daily chart

Trend: Further upside expected

Additional important levels

Overview
Today last price113.07
Today Daily Change3.15
Today Daily Change %2.87%
Today daily open109.92
 
Trends
Daily SMA20106.67
Daily SMA50104.34
Daily SMA10097.95
Daily SMA20086.19
 
Levels
Previous Daily High110.84
Previous Daily Low108.48
Previous Weekly High113.18
Previous Weekly Low102.99
Previous Monthly High109.13
Previous Monthly Low92.65
Daily Fibonacci 38.2%109.94
Daily Fibonacci 61.8%109.38
Daily Pivot Point S1108.66
Daily Pivot Point S2107.39
Daily Pivot Point S3106.3
Daily Pivot Point R1111.01
Daily Pivot Point R2112.1
Daily Pivot Point R3113.36

Author

Anil Panchal

Anil Panchal

FXStreet

Anil Panchal has nearly 15 years of experience in tracking financial markets. With a keen interest in macroeconomics, Anil aptly tracks global news/updates and stays well-informed about the global financial moves and their implications.

More from Anil Panchal
Share:

Editor's Picks

EUR/USD rebounds from session lows, stays below 1.1650

EUR/USD is recovers modestly from session lows but remains in the red below 1.1650 in European trading on Thursday. The pair faces headwinds from a renewed uptick in the US Dollar amid a negative shift in risk sentiment. Surging energy prices due to the Middle East war keep the bearish pressure intact on the Euro. The US Jobless Claims data are next of note. 

GBP/USD stays weak near 1.3350 amid UK stagflation risks

GBP/USD sticks to losses near 1.3350 in the European session on Thursday. The Pound Sterling loses ground amid fears that the United Kingdom economy could face stagflation risks due to higher energy prices, while the US Dollar attracts fresh havem demand ahead of the US Jobless Claims data. 

Gold climbs near $5,200 as Iran war fuels safe-haven demand

Gold price extends its gains for the second successive session on Thursday as traders seek safety amid the ongoing war in the Middle East. US and Israeli strikes across Iranian territory and widespread Iranian missile and drone retaliation across the Middle East, including attacks on regional targets and military sites, prolong the crisis and its impact.

Three reasons to be bearish on Bitcoin

Bitcoin is holding up well taking into account the uncertainty stemming from the Middle East. Despite this week’s rally, the long-term outlook remains bearish. Here are three reasons why I think the storm for the largest cryptocurrency isn't over yet.

Markets attempt to rally on positive news from Iran

There’s been an abrupt change in sentiment this morning, European stock markets are higher and oil and gas prices are moderating, after comments from Iran’s deputy minister about pre-conflict talks between Iran and the US.

Cardano Price Analysis: Approaches key trendline amid bearish sentiment

Cardano (ADA) price is approaching its descending trendline around $0.28 at the time of writing, set to shape the next directional move. The derivatives metrics paint a bearish picture, with ADA’s Open Interest continuing to fall and short bets rising among traders.