|

WTI Price Analysis: Sellers eye $40.40/35 zone on bearish candlestick play

  • WTI fades upside momentum, eases from $41.51 off-late.
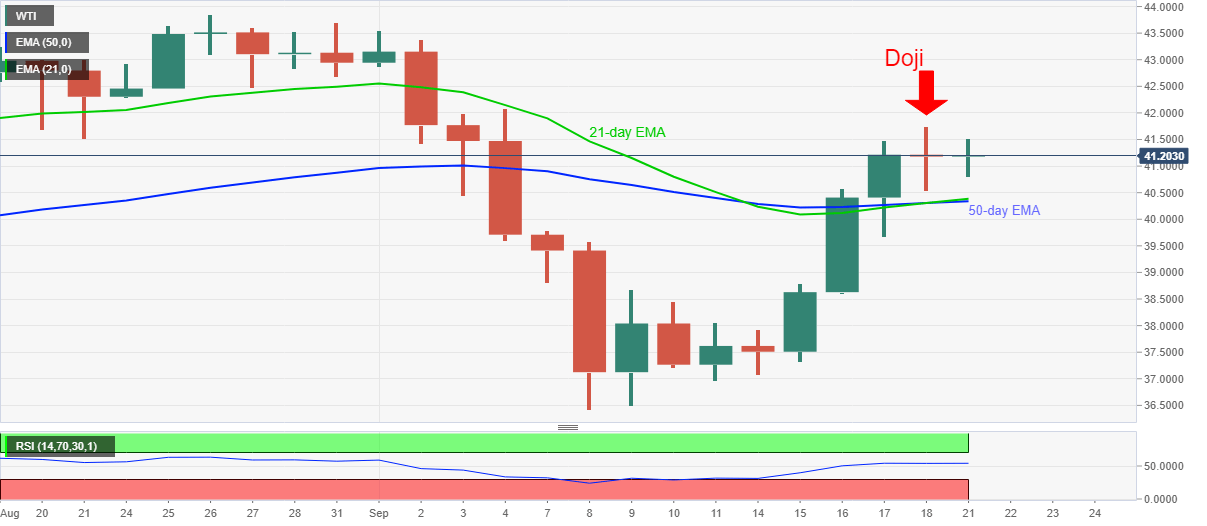
  • Friday’s Doji directs bears towards 21 and 50-day EMA confluence.
  • Bulls remain cautious unless refreshing the monthly top.

Despite stepping back from intraday high of $41.51 to currently around $41.22, WTI prints 0.16% intraday gain ahead of Monday’s European session. The energy benchmark portrayed a bearish candlestick formation on Friday, which in turn can recall the near-term key support area unless the quote crosses $41.75.

In addition to the confluence of 21 and 50-day EMA joint near $40.40/35, the $40.00 round-figures and $38.60 can also lure the bears during WTI’s fresh downside.

Though, any more weakness past-$38.60 will make the black gold vulnerable enough to revisit the monthly bottom surrounding $36.40.

Alternatively, an upside clearance of Friday’s top near $41.75 can direct the bulls towards the month-start low near $42.90.

Should the WTI bulls manage to keep the reins beyond $42.90, the monthly peak near $43.55 and August month’s high close to $43.86 can probe the oil traders before offering them the $44.00 threshold.

WTI daily chart

Trend: Pullback expected

Additional important levels

Overview
Today last price41.2
Today Daily Change0.02
Today Daily Change %0.05%
Today daily open41.18
 
Trends
Daily SMA2040.66
Daily SMA5041.26
Daily SMA10038.24
Daily SMA20040.93
 
Levels
Previous Daily High41.75
Previous Daily Low40.54
Previous Weekly High41.75
Previous Weekly Low37.08
Previous Monthly High43.86
Previous Monthly Low39.75
Daily Fibonacci 38.2%41
Daily Fibonacci 61.8%41.29
Daily Pivot Point S140.56
Daily Pivot Point S239.95
Daily Pivot Point S339.36
Daily Pivot Point R141.77
Daily Pivot Point R242.36
Daily Pivot Point R342.98

Author

Anil Panchal

Anil Panchal

FXStreet

Anil Panchal has nearly 15 years of experience in tracking financial markets. With a keen interest in macroeconomics, Anil aptly tracks global news/updates and stays well-informed about the global financial moves and their implications.

More from Anil Panchal
Share:

Editor's Picks

EUR/USD deflates to fresh lows, targets 1.1600

The selling pressure on EUR/USD now gathers extra pace, prompting the pair to hit fresh multi-week lows in the 1.1625-1.1620 band on Friday. The continuation of the downward bias comes in response to further gains in the US Dollar as market participants continue to assess the mixed release of US Nonfarm Payrolls in December.

GBP/USD breaks below 1.3400, challenges the 200-day SMA

GBP/USD remains under heavy fire and retreats for the fourth consecutive day on Friday. Indeed, Cable suffers the strong performance of the Greenback, intensified post-mixed NFP, and trades at shouting distance from its critical 200-day SMA near 1.3380.

Gold flirts with yearly tops around $4,500

Gold keeps its positive bias on Friday, adding to Thursday’s advance and challenging yearly highs in the $4,500 region per troy ounce. The risk-off sentiment favours the yellow metal despite the firmer tone in the Greenback and rising US Treasury yields.

Crypto Today: Bitcoin, Ethereum, XRP risk further decline as market fear persists amid slowing demand

Bitcoin holds $90,000 but stays below the 50-day EMA as institutional demand wanes. Ethereum steadies above $3,000 but remains structurally weak due to ETF outflows. XRP ETFs resume inflows, but the price struggles to gain ground above key support.

Week ahead – US CPI might challenge the geopolitics-boosted Dollar

Geopolitics may try to steal the limelight from US data. A possible US Supreme Court ruling on tariffs could dictate market movements. A crammed data calendar next week, US CPI comes on Tuesday; Fedspeak to intensify.

XRP trades under pressure amid weak retail demand

XRP presses down on the 50-day EMA support as risk-averse sentiment spreads despite a positive start to 2026. XRP faces declining retail demand, as reflected in futures Open Interest, which has fallen to $4.15 billion.