WTI Price Analysis: Retreats from $92.25 resistance confluence
- WTI pares intraday gains as key HMAs test buyers during three-day uptrend.
- Weekly support break also adds to the bearish bias.
- Bears need validation from 23.6% Fibonacci retracement, $90.00.

WTI crude oil prices drop back towards $92.00 while consolidating intraday gains ahead of Wednesday’s European session.
Although a convergence of the 50-HMA and 200-HMA guards the quote’s immediate upside, the black gold prints the third consecutive positive daily candle at the latest.
Other than the failures to cross the $92.20-25 HMA convergence, a sustained trading below the previous support line from February 18, around $93.65 by the press time, also keep WTI sellers hopeful.
Even so, the 23.6% Fibonacci retracement of February 15-23 downside, near $90.60, will precede the $90.00 psychological magnet to test short-term declines.
Following that, the latest swing low and the monthly bottom, near $87.45 and $86.55, will lure the WTI crude oil bears.
On the flip side, a clear break of the $92.25 will aim for the $93.00 threshold before challenging the support-turned-resistance trend line near $93.65.
In a case where oil buyers remain dominant past $93.65, the $95.00 round figure may act as a buffer before directing the upside moves to the monthly high near $95.85, also the highest levels since late 2014.
WTI: Hourly chart
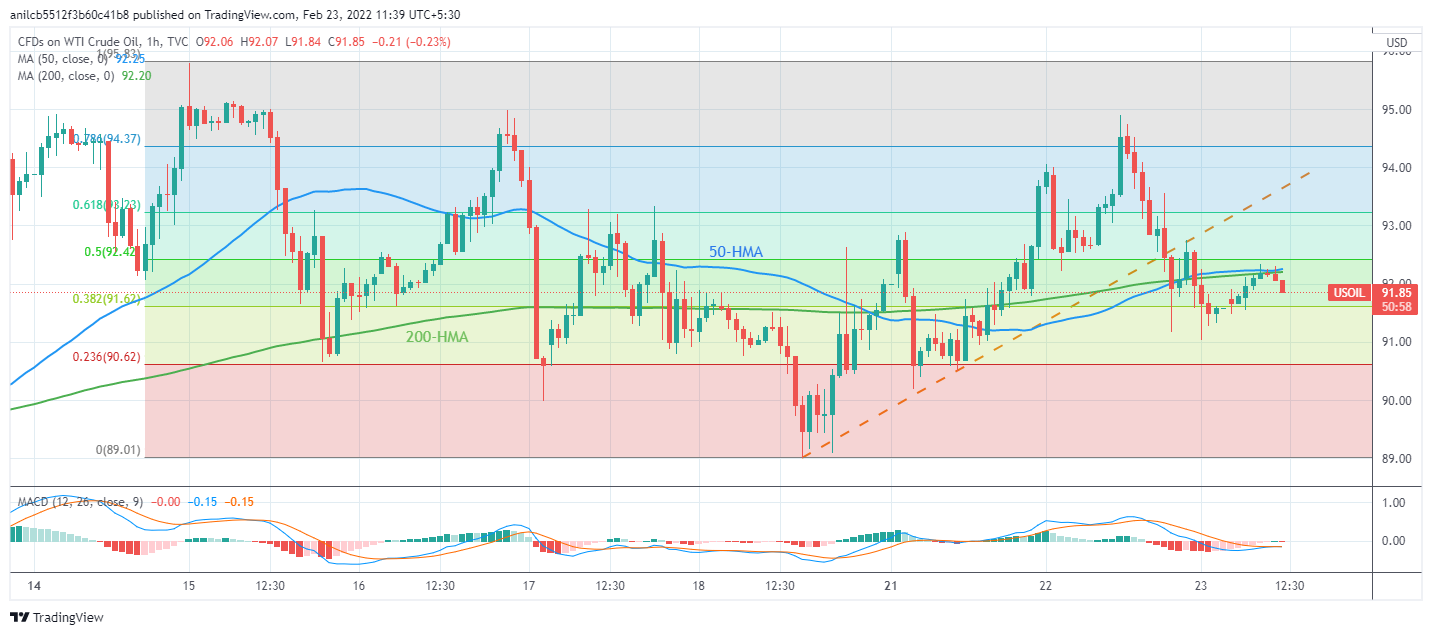
Trend: Pullback expected
Author

Anil Panchal
FXStreet
Anil Panchal has nearly 15 years of experience in tracking financial markets. With a keen interest in macroeconomics, Anil aptly tracks global news/updates and stays well-informed about the global financial moves and their implications.


