|

WTI Price Analysis: Prints three-day uptrend on the way to $71.00

  • WTI stays firmer around six-week high, picks up bids of late.
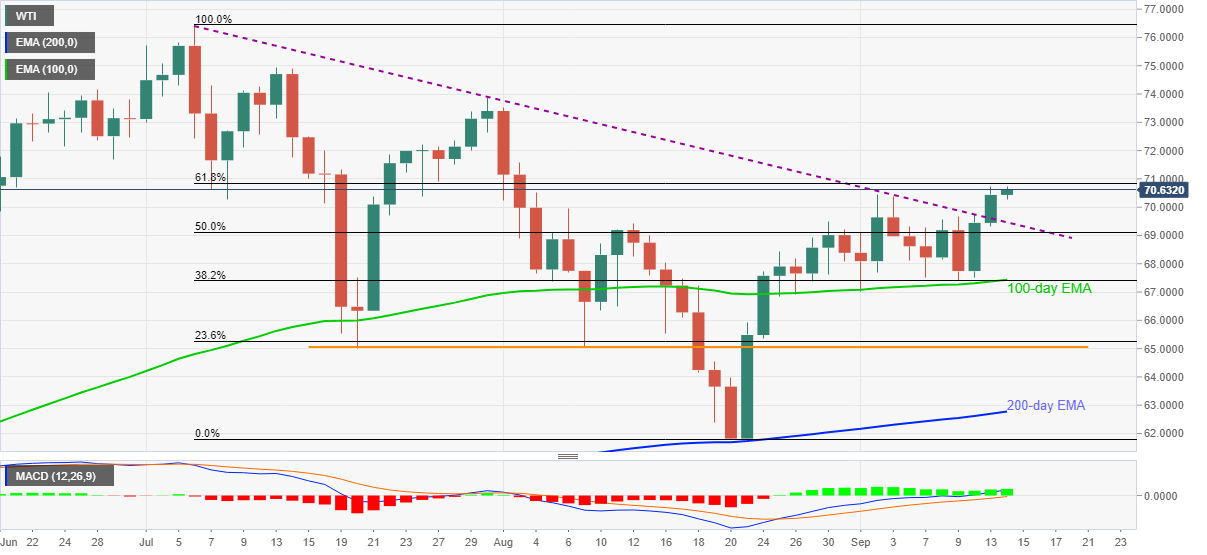
  • Bullish MACD, sustained rebound from 100-day EMA, upside break of multi-day-old resistance line favor buyers.
  • 61.8% Fibonacci retracement of July-August fall guards immediate upside.

WTI takes the bids around $70.65, up 0.30% intraday during early Tuesday. In doing so, the black gold rises for the third consecutive day after refreshing the highest levels since early August the previous day.

Given the bullish MACD signals and the quote’s ability to keep recovery moves from 100-day EMA, not to forget breaking a downward sloping resistance line from July 03, WTI stays directed towards the 61.8% Fibonacci retracement (Fibo) level surrounding $70.85.

Following that, the $71.00 threshold will act as a validation point before fueling the energy prices towards the late July tops near $73.90.

Meanwhile, the resistance-turned-support near $69.45 acts as an immediate catalyst to trigger the profit-booking moves if broken.

Even so, WTI bears will remain skeptical unless witnessing a clear downside break of $67.40 comprising 100-day EMA and 38.2% Fibo.

In a case where the commodity prices remain pressured towards the south following the $67.40 breakdown, a two-month-old horizontal area around $65.00 will be in focus.

WTI: Daily chart

Trend: Further upside expected

Additional important levels

Overview
Today last price70.67
Today Daily Change0.24
Today Daily Change %0.34%
Today daily open70.43
 
Trends
Daily SMA2067.55
Daily SMA5069.36
Daily SMA10068.82
Daily SMA20062.64
 
Levels
Previous Daily High70.72
Previous Daily Low69.3
Previous Weekly High69.75
Previous Weekly Low67.41
Previous Monthly High73.54
Previous Monthly Low61.73
Daily Fibonacci 38.2%70.18
Daily Fibonacci 61.8%69.85
Daily Pivot Point S169.58
Daily Pivot Point S268.73
Daily Pivot Point S368.16
Daily Pivot Point R171
Daily Pivot Point R271.58
Daily Pivot Point R372.43

Author

Anil Panchal

Anil Panchal

FXStreet

Anil Panchal has nearly 15 years of experience in tracking financial markets. With a keen interest in macroeconomics, Anil aptly tracks global news/updates and stays well-informed about the global financial moves and their implications.

More from Anil Panchal
Share:

Editor's Picks

EUR/USD stays below 1.1850 as Fed policy signals weigh on sentiment

EUR/USD edges modestly higher after opening with a downside gap, trading near 1.1840 during Monday’s Asian session. However, the pair remains vulnerable to further downside as the US Dollar finds support following President Donald Trump’s nomination of Kevin Warsh as the next Federal Reserve Chair.

GBP/USD holds steady near 1.3700 as markets assess Warsh's Fed outlook

The GBP/USD pair trades on a flat note near 1.3695 during the early Asian session on Monday. Traders weigh what a Federal Reserve under Kevin Warsh might look like. The US ISM Manufacturing Purchasing Managers Index report will be published later on Monday. 

Gold: Will it defend 21-day SMA on a daily closing basis?

Gold halts its correction as sellers take a breather, with the NFP week kicking in. The US Dollar fades its recovery stint as markets weigh a Fed under Warsh. Geopolitical tensions seem to ease. Technically, RSI flirts with midline on the daily chart; Gold is at a critical crossroads.

Bitcoin slips below $75,000 as selling pressure accelerates

Bitcoin (BTC) price falls below the $75,000 mark on Monday, having corrected nearly 11% in the previous week and reaching level not seen in nearly 10 months. Market momentum has clearly turned bearish, with technical indicators pointing to further downside toward the next key support at $70,000.

Global central banks hold steady as EMs signal easing ahead

Central banks across both G10 and emerging markets met this week, with most opting to keep policy rates unchanged. Canada, Sweden, Brazil and Chile all held rates steady. Beyond central bank decisions, the Eurozone's solid Q4 GDP growth bolstered the case for the ECB to keep policy rates unchanged next week.

Bitcoin slips below $75,000 as selling pressure accelerates

Bitcoin (BTC) price falls below the $75,000 mark on Monday, having corrected nearly 11% in the previous week and reaching level not seen in nearly 10 months. Market momentum has clearly turned bearish, with technical indicators pointing to further downside toward the next key support at $70,000.