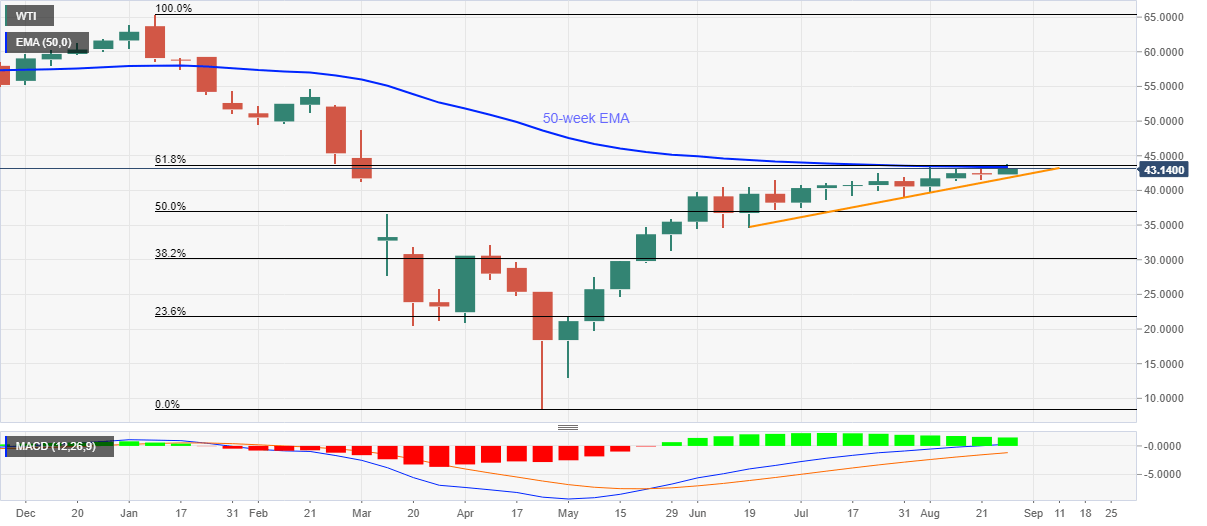
WTI Price Analysis: Prints a month of battle below 50-week SMA, 61.8% Fibonacci retracement


  • WTI stays below a confluence of key SMA, Fibonacci retracement for fourth week in a row.
  • Bullish MACD, sustained trading beyond an ascending trend line from June 19 favor the buyers.
  • 50% Fibonacci retracement adds to the downside support.

WTI seesaws around $43.10 before the European traders gather for Friday’s bell. The black gold surged to the highest since early-March on Wednesday. However, a confluence of the 50-week SMA and 61.8% Fibonacci retracement level of the January-March fall restricts the quote’s upside afterward.

Even so, bullish MACD and repeated bounces off a multi-day-old support line raise bars for the sellers’ entry,

As a result, the energy benchmark is likely to remain dismal unless breaking the area between $41.80 and $43.60, comprising the key EMA and the mentioned support line respectively.

It should be noted that February month low near $44.00 adds to the upside barrier before driving it north to March month’s top around $48.75.

On the contrary, a downside break of $41.80 can take an intermediate halt near the $40.00 threshold before challenging a 50% Fibonacci retracement level of $36.88.

WTI weekly chart

Trend: Bullish

Additional important levels

Overview
Today last price 43.11
Today Daily Change 0.01
Today Daily Change % 0.02%
Today daily open 43.1
 
Trends
Daily SMA20 42.39
Daily SMA50 41.21
Daily SMA100 35.28
Daily SMA200 42.33
 
Levels
Previous Daily High 43.6
Previous Daily Low 42.48
Previous Weekly High 43.3
Previous Weekly Low 41.51
Previous Monthly High 42.52
Previous Monthly Low 38.73
Daily Fibonacci 38.2% 42.91
Daily Fibonacci 61.8% 43.17
Daily Pivot Point S1 42.52
Daily Pivot Point S2 41.94
Daily Pivot Point S3 41.39
Daily Pivot Point R1 43.65
Daily Pivot Point R2 44.19
Daily Pivot Point R3 44.77


Share: Feed news

Information on these pages contains forward-looking statements that involve risks and uncertainties. Markets and instruments profiled on this page are for informational purposes only and should not in any way come across as a recommendation to buy or sell in these assets. You should do your own thorough research before making any investment decisions. FXStreet does not in any way guarantee that this information is free from mistakes, errors, or material misstatements. It also does not guarantee that this information is of a timely nature. Investing in Open Markets involves a great deal of risk, including the loss of all or a portion of your investment, as well as emotional distress. All risks, losses and costs associated with investing, including total loss of principal, are your responsibility. The views and opinions expressed in this article are those of the authors and do not necessarily reflect the official policy or position of FXStreet nor its advertisers. The author will not be held responsible for information that is found at the end of links posted on this page.

If not otherwise explicitly mentioned in the body of the article, at the time of writing, the author has no position in any stock mentioned in this article and no business relationship with any company mentioned. The author has not received compensation for writing this article, other than from FXStreet.

FXStreet and the author do not provide personalized recommendations. The author makes no representations as to the accuracy, completeness, or suitability of this information. FXStreet and the author will not be liable for any errors, omissions or any losses, injuries or damages arising from this information and its display or use. Errors and omissions excepted.

The author and FXStreet are not registered investment advisors and nothing in this article is intended to be investment advice.

Recommended content


Recommended content

Editors’ Picks

AUD/USD hovers around 0.6500 amid light trading, ahead of US GDP

AUD/USD hovers around 0.6500 amid light trading, ahead of US GDP

AUD/USD is trading close to 0.6500 in Asian trading on Thursday, lacking a clear directional impetus amid an Anzac Day holiday in Australia. Meanwhile, traders stay cautious due ti risk-aversion and ahead of the key US Q1 GDP release. 

AUD/USD News

USD/JPY finds its highest bids since 1990, near 155.50

USD/JPY finds its highest bids since 1990, near 155.50

USD/JPY keeps breaking into its highest chart territory since June of 1990 early Thursday, testing 155.50 for the first time in 34 years as the Japanese Yen remains vulnerable, despite looming Japanese intervention risks. Focus shifts to Thursday's US GDP report and the BoJ decision on Friday. 

USD/JPY News

Gold price lacks firm intraday direction, holds steady above $2,300 ahead of US data

Gold price lacks firm intraday direction, holds steady above $2,300 ahead of US data

Gold price remains confined in a narrow band for the second straight day on Thursday. Reduced Fed rate cut bets and a positive risk tone cap the upside for the commodity. Traders now await key US macro data before positioning for the near-term trajectory.

Gold News

Injective price weakness persists despite over 5.9 million INJ tokens burned

Injective price weakness persists despite over 5.9 million INJ tokens burned

Injective price is trading with a bearish bias, stuck in the lower section of the market range. The bearish outlook abounds despite the network's deflationary efforts to pump the price. Coupled with broader market gloom, INJ token’s doomed days may not be over yet.

Read more

Meta Platforms Earnings: META sinks 10% on lower Q2 revenue guidance Premium

Meta Platforms Earnings: META sinks 10% on lower Q2 revenue guidance

This must be "opposites" week. While Doppelganger Tesla rode horrible misses on Tuesday to a double-digit rally, Meta Platforms produced impressive beats above Wall Street consensus after the close on Wednesday, only to watch the share price collapse by nearly 10%.

Read more

Forex MAJORS

Cryptocurrencies

Signatures