|

WTI Price Analysis: Oil snaps two-day winning streak as sellers attack 200-SMA above $71.00

  • WTI crude oil takes offers to renew intraday low during the first loss-making day in three.
  • Oil price pulls back from fortnight-old resistance line amid nearly overbought RSI.
  • Bullish MACD signals keep energy buyers hopeful above weekly support line, 1.5-month-old horizontal support.

WTI crude oil pares the previous weekly gains, the first in three, as it renews intraday low near $71.30 to snap a two-day uptrend amid early Monday.

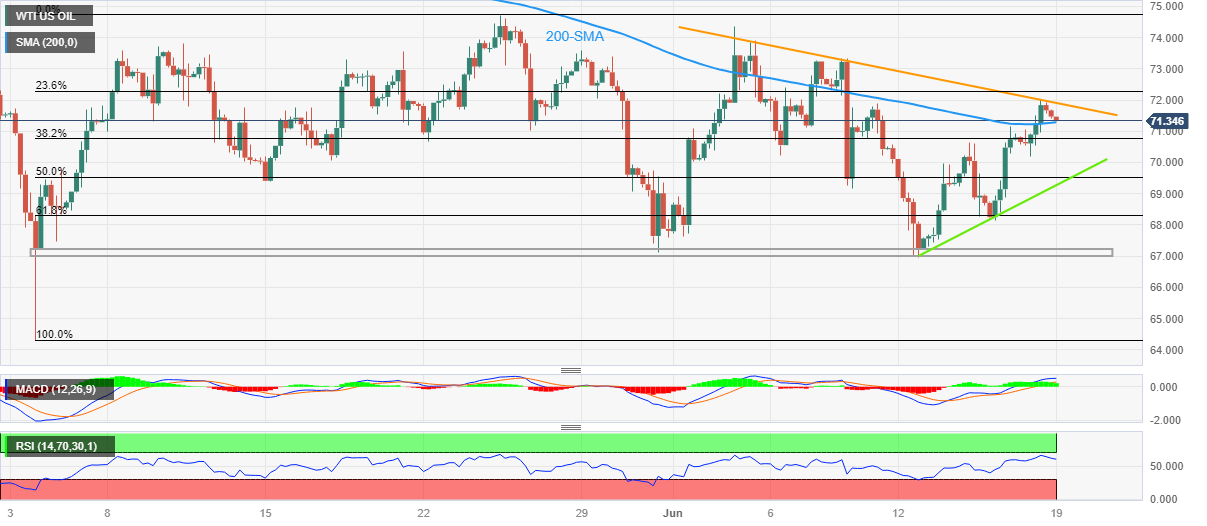
In doing so, the black gold reverses from a two-week-old descending resistance line amid nearly overbought RSI (14). However, the bullish MACD signals and the 200-SMA, around $71.30 by the press time, challenge the Oil bears.

It should be noted, however, that a clear break of the 200-SMA won’t hesitate to prod the $70.00 psychological magnet while the 50% Fibonacci retracement of May 03-24 upside, near $69.50, may test the energy benchmark bears afterward.

In a case where the WTI crude oil remains bearish past $69.50, a one-week-old ascending support line and a horizontal area comprising multiple lows marked since early May, respectively near $69.30 and $67.20-67.00, will be in the spotlight.

On the contrary, Oil’s recovery needs validation from the aforementioned resistance line of around $72.00, a break of which can direct the energy bulls toward the multiple hurdles marked near $73.50.

However, the WTI recovery remains elusive unless the quote stays below the late May swing high of near $74.70.

WTI crude oil: Four-hour chart

Trend: Limited downside expected

Additional important levels

Overview
Today last price71.33
Today Daily Change-0.34
Today Daily Change %-0.47%
Today daily open71.67
 
Trends
Daily SMA2071.14
Daily SMA5073.67
Daily SMA10074.71
Daily SMA20078.19
 
Levels
Previous Daily High72.02
Previous Daily Low70.19
Previous Weekly High72.02
Previous Weekly Low66.95
Previous Monthly High76.61
Previous Monthly Low64.31
Daily Fibonacci 38.2%71.32
Daily Fibonacci 61.8%70.89
Daily Pivot Point S170.56
Daily Pivot Point S269.46
Daily Pivot Point S368.72
Daily Pivot Point R172.4
Daily Pivot Point R273.13
Daily Pivot Point R374.24

Author

Anil Panchal

Anil Panchal

FXStreet

Anil Panchal has nearly 15 years of experience in tracking financial markets. With a keen interest in macroeconomics, Anil aptly tracks global news/updates and stays well-informed about the global financial moves and their implications.

More from Anil Panchal
Share:

Markets move fast. We move first.

Orange Juice Newsletter brings you expert driven insights - not headlines. Every day on your inbox.

By subscribing you agree to our Terms and conditions.

Editor's Picks

EUR/USD climbs toward 1.1800 on broad USD weakness

EUR/USD gathers bullish momentum and advances toward 1.1800 in the second half of the day on Tuesday. The US Dollar weakens and helps the pair stretch higher after the employment report showed that Nonfarm Payrolls declined by 105,000 in October before rising by 64,000 in November.

GBP/USD climbs to fresh two-month high above 1.3400

GBP/USD gains traction in the American session and trades at its highest level since mid-October above 1.3430. The British Pound benefits from upbeat PMI data, while the US Dollar struggles to find demand following the mixed employment figures and weaker-than-forecast PMI prints, allowing the pair to march north.

Gold recovers above $4,300 as markets react to weak US data

Gold trades in positive above $4,300 after spending the first half of the day under bearish pressure. XAU/USD capitalizes on renewed USD weakness after the jobs report showed that the Unemployment Rate climbed to 4.6% in November and the PMI data revealed a loss of growth momentum in the private sector in December. 

US Retail Sales virtually unchanged at $732.6 billion in October

Retail Sales in the United States were virtually unchanged at $732.6 billion in October, the US Census Bureau reported on Tuesday. This print followed the 0.1% increase (revised from 0.3%) recorded in September and came in below the market expectation of +0.1%.

Ukraine-Russia in the spotlight once again

Since the start of the week, gold’s price has moved lower, but has yet to erase the gains made last week. In today’s report we intend to focus on the newest round of peace talks between Russia and Ukraine, whilst noting the release of the US Employment data later on day and end our report with an update in regards to the tensions brewing in Venezuela.

BNB Price Forecast: BNB slips below $855 as bearish on-chain signals and momentum indicators turn negative

BNB, formerly known as Binance Coin, continues to trade down around $855 at the time of writing on Tuesday, after a slight decline the previous day. Bearish sentiment further strengthens as BNB’s on-chain and derivatives data show rising retail activity.