|

WTI Price Analysis: Oil buyers run out of steam near $72.00 as markets brace for data

  • WTI clings to mild gains around two-week high, up for the third consecutive day.
  • Clear break of six-week-old falling resistance line, weekly bullish channel keep Oil buyers hopeful.
  • Overbought RSI, cautious mood ahead of key US data prod energy bulls.
  • WTI crude oil sellers need to break $70.70 to retake control.

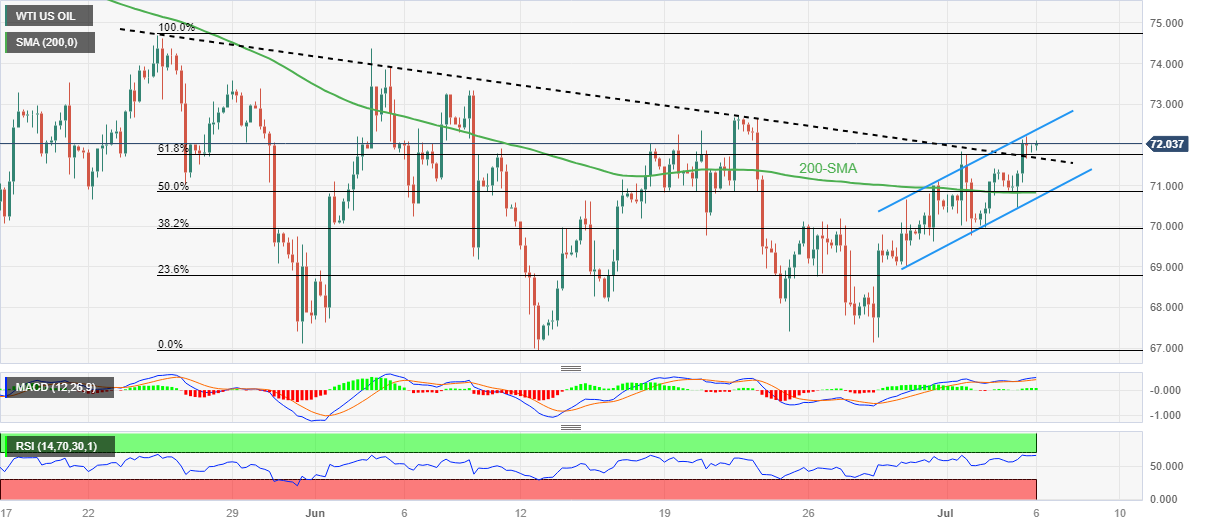
WTI crude oil struggles to refresh a two-week high while sticking to mild gains around $72.00 amid early Thursday in Europe. In doing so, the black gold remains within a one-week-old rising trend channel as it makes rounds to the weekly top.

The oil benchmark’s latest upside also takes clues from the clear upside break of a previously important resistance line stretched from late May, as well as the quote’s run-up beyond the 61.8% Fibonacci retracement of May 24 to June 12 downside, near $71.70-65 at the latest.

Further, bullish MACD signals also favor black gold buyers.

However, the overbought RSI conditions and the nearness to the one-week-old rising channel’s top line, close to $72.40 by the press time, challenge the WTI bulls. Following that, the late June swing high of around $72.70 can act as the final defense of the oil bears.

Meanwhile, the market’s positioning for the US ISM Services PMI and ADP Employment Change for June, as well as the Eurozone Retail Sales for May, seem to play its role in challenging the Oil traders of late.

That said, a downside break of $71.65 can trigger a quick fall of the WTI price towards a $70.80 support confluence including the 50% Fibonacci retracement and 200-SMA.

Though, the aforementioned bullish channel’s support line, close to $70.70 at the latest, can challenge the Oil bears afterward.

WTI crude oil: Four-hour chart

Trend: Pullback expected

Additional important levels

Overview
Today last price72.03
Today Daily Change0.18
Today Daily Change %0.25%
Today daily open71.85
 
Trends
Daily SMA2070.2
Daily SMA5071.25
Daily SMA10073.74
Daily SMA20077.33
 
Levels
Previous Daily High72.21
Previous Daily Low70.45
Previous Weekly High71.11
Previous Weekly Low67.14
Previous Monthly High74.36
Previous Monthly Low66.95
Daily Fibonacci 38.2%71.54
Daily Fibonacci 61.8%71.13
Daily Pivot Point S170.8
Daily Pivot Point S269.74
Daily Pivot Point S369.04
Daily Pivot Point R172.56
Daily Pivot Point R273.27
Daily Pivot Point R374.32

Author

Anil Panchal

Anil Panchal

FXStreet

Anil Panchal has nearly 15 years of experience in tracking financial markets. With a keen interest in macroeconomics, Anil aptly tracks global news/updates and stays well-informed about the global financial moves and their implications.

More from Anil Panchal
Share:

Markets move fast. We move first.

Orange Juice Newsletter brings you expert driven insights - not headlines. Every day on your inbox.

By subscribing you agree to our Terms and conditions.

Editor's Picks

EUR/USD bounces toward 1.1750 as US Dollar loses strength

EUR/USD returned to the 1.1750 price zone in the American session on Friday, despite falling Wall Street, which indicates risk aversion. Trading conditions remain thin following the New Year holiday and ahead of the weekend, with the focus shifting to US employment and European data scheduled for next week.

GBP/USD nears 1.3500, holds within familiar levels

After testing 1.3400 on the last day of 2025, GBP/USD managed to stage a rebound. Nevertheless, the pair finds it difficult to gather momentum and trades with modest intraday gains at around 1.3490 as market participants remain in holiday mood.

Gold trims intraday gains, approaches $4,300

Gold retreated sharply from the $4,400  area and trades flat for the day in the $4,320 price zone. Choppy trading conditions exacerbated the intraday decline, although XAU/USD bearish case is out of the picture, considering growing expectations for a dovish Fed and persistent geopolitical tensions.

Cardano gains early New Year momentum, bulls target falling wedge breakout

Cardano kicks off the New Year on a positive note and is extending gains, trading above $0.36 at the time of writing on Friday. Improving on-chain and derivatives data point to growing bullish interest, while the technical outlook keeps an upside breakout in focus.

Economic outlook 2026-2027 in advanced countries: Solidity test

After a year marked by global economic resilience and ending on a note of optimism, 2026 looks promising and could be a year of solid economic performance. In our baseline scenario, we expect most of the supportive factors at work in 2025 to continue to play a role in 2026.

Crypto market outlook for 2026

Year 2025 was volatile, as crypto often is.  Among positive catalysts were favourable regulatory changes in the U.S., rise of Digital Asset Treasuries (DAT), adoption of AI and tokenization of Real-World-Assets (RWA).