|

WTI Price Analysis: Off intraday low but key SMAs to test the bulls

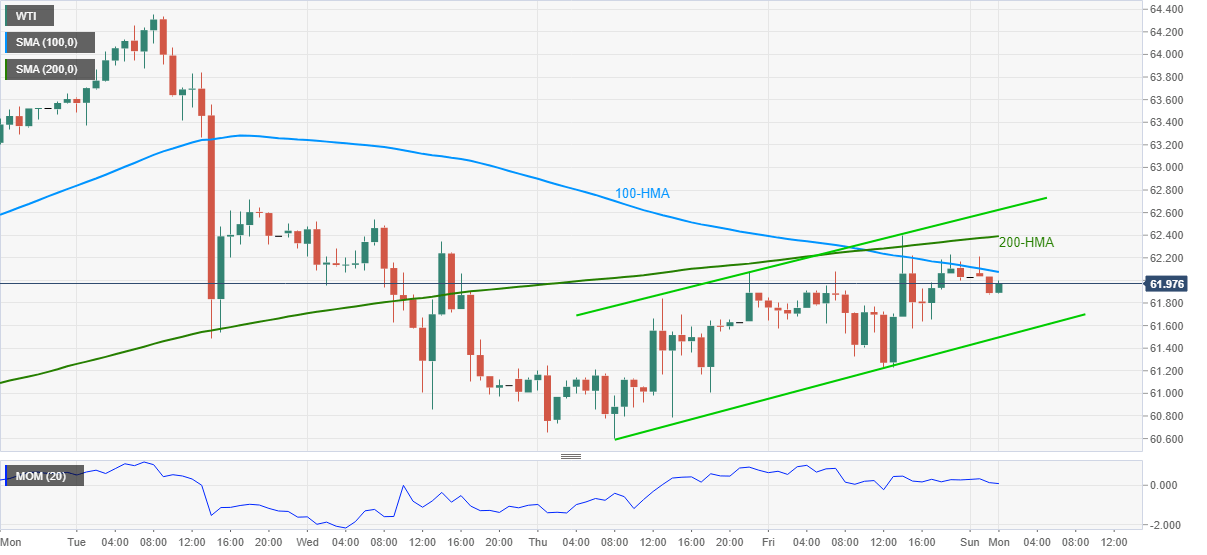
  • WTI picks up bids inside a short-term rising channel.
  • Easing Momentum, key SMA challenge corrective pullback.
  • Bears will look for entries below $61.50, buyers to have a bumpy road ahead.

WTI struggles to regain $62.00, down 0.15% near $61.95, despite the recent bounce off intraday low during Monday’s Asian session.

Although an upward sloping trend channel from last Thursday portrays the black gold’s short-term recovery moves, the Momentum indicator’s retreat and nearness to the crucial SMA resistances seek to test the corrective pullback.

Not only the 100 and 200-HMA, respectively around $62.10 and $62.40, but the upper line of the stated channel near $62.60 could also raise challenges for the WTI buyers.

Alternatively, a downside break of the immediate channel’s support line, near $61.50 by the press time, precedes $61.20 and the $60.00 threshold to restrict the commodity’s short-term downside.

However, any further weakness past-$60.00 will not hesitate to conquer the monthly low of $57.66.

WTI hourly chart
Trend: Pullback expected

Additional important levels

Overview
Today last price61.95
Today Daily Change-0.08
Today Daily Change %-0.13%
Today daily open62.03
 
Trends
Daily SMA2061.02
Daily SMA5061.64
Daily SMA10056.31
Daily SMA20048.67
 
Levels
Previous Daily High62.39
Previous Daily Low61.23
Previous Weekly High64.36
Previous Weekly Low60.6
Previous Monthly High67.87
Previous Monthly Low57.27
Daily Fibonacci 38.2%61.95
Daily Fibonacci 61.8%61.67
Daily Pivot Point S161.37
Daily Pivot Point S260.72
Daily Pivot Point S360.2
Daily Pivot Point R162.54
Daily Pivot Point R263.05
Daily Pivot Point R363.71

Author

Anil Panchal

Anil Panchal

FXStreet

Anil Panchal has nearly 15 years of experience in tracking financial markets. With a keen interest in macroeconomics, Anil aptly tracks global news/updates and stays well-informed about the global financial moves and their implications.


More from Anil Panchal
Share:

Editor's Picks

AUD/USD sits near a one-month top, above 0.7000 amid fresh USD selling

AUD/USD holds above 0.7000 through the Asian session, trading near a one-month high touched earlier this Monday amid renewed US Dollar selling. US bond yields decline further amid a modest pullback in crude oil prices, capping the USD recovery from a three-week low. Moreover, bets for a November RBA rate hike support the Aussie, though upside seems capped ahead of the crucial two-day FOMC meeting, starting Tuesday.

USD/JPY struggles below 157.00 on weak USD; holds above one-month low ahead of Fed, BoJ meetings

USD/JPY attracts fresh sellers during the Asian session on Monday, stalling its recovery from the lowest level since September 18, touched Friday as a further decline in US bond yields weighs on the US Dollar. Meanwhile, the Japanese Yen benefits from a more hawkish BoJ, further weighing on the currency pair. The downside, however, seems limited as traders keenly await Fed and BoJ policy meetings later this week.

Gold sticks to modest recovery gains above $4,000 as Fed hike bets cap upside

Gold stages a modest recovery from the vicinity of a three-month low, trading above the $4,000 psychological mark through Monday’s Asian session amid a softer US Dollar. US President Donald Trump has ruled out immediate military action against Iran, triggering a modest pullback in crude oil prices. Furthermore, Federal Reserve officials have signaled no urgency to raise interest rates immediately.

Cardano's derivatives and on-chain data confirm bears in control

Cardano extends losses, trading below $0.202 after three consecutive weeks of more than 20% declines since early October. Selling pressure continues to build as weakening derivatives metrics, bearish on-chain signals and a deteriorating technical outlook point to further downside risks. Derivatives data shows a bearish bias for Cardano.

Flight to safety meets a high earnings bar as central bank week begins

Treasuries rallied again, equities are struggling, and central banks and earnings are on the horizon. Last week, US Treasuries rallied for a second consecutive week. This pushed 10s and 30s to 5% and 5.33%, respectively, flattening the curve even as Brent crude rallied about 7% to within striking distance of March peaks at US$119.50, and tech stocks posted a second straight week of losses.

What November 3 means for the Fed's rate path and the US Dollar

The USD faces a decisive period ahead of the November 3 midterm elections. While markets anticipate another interest rate increase from the Fed in December, the battle for control of Congress could reshape fiscal policy expectations and, indirectly, the path of US monetary policy in 2027.