|

WTI Price Analysis: Mildly offered below $72.00 as bulls step back from 21-DMA

  • WTI refreshes intraday low, drops the most in a week.
  • Steady RSI backs sideways moves between 21 and 50-DMA.
  • Three-week-old descending trend line adds to the upside filters.

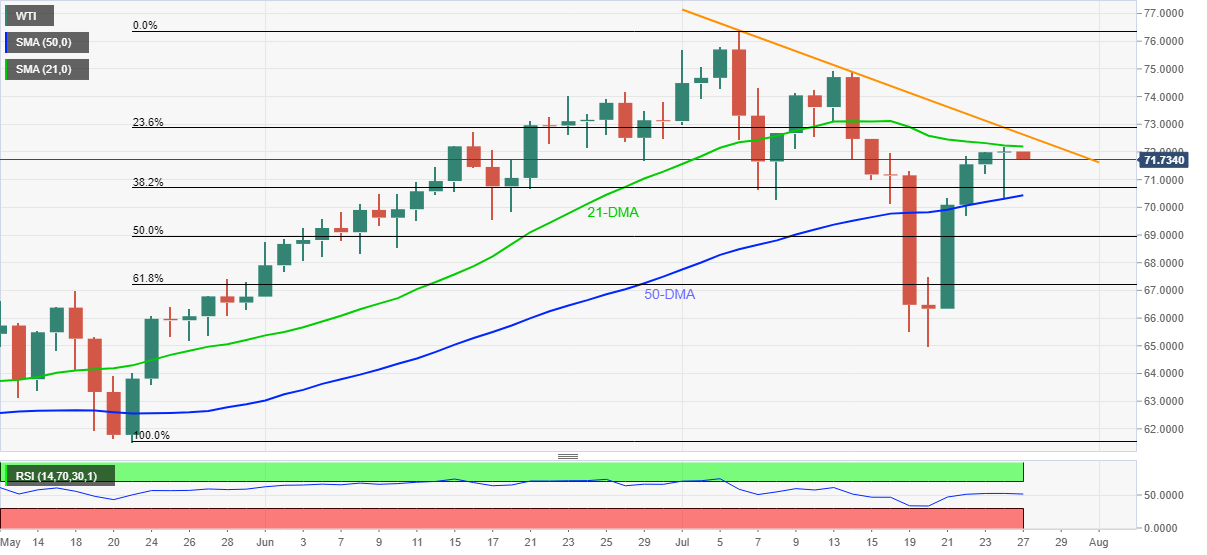
WTI crude oil takes offers around $71.70, down 0.40% intraday, amid Tuesday’s Asian trading. The oil benchmark refreshed one week top the previous day before taking a U-turn from 21-DMA. It should be noted, however, that the quote keeps an upside break of 50-DMA amid a steady RSI line.

Hence, a sideways grind is likely to continue, despite anticipated short-term weakness towards the 50-DMA support of $70.43.

If at all the WTI sellers break the $70.40 level, the $70.00 threshold will be important before the 61.8% Fibonacci retracement level of May-July upside, around $67.20.

Meanwhile, an upside clearance of 21-DMA, at $72.20 by the press time, isn’t offering a green pass to the oil bulls as a descending resistance line from July 06, near $72.65, will challenge the quote’s short-term advances.

Also acting as the key upside hurdle is the July 13 peak surrounding $75.00, a break of which will refresh the multi-month top, marked early in July, around $76.40.

WTI: Daily chart

Trend: Sideways

Additional important levels

Overview
Today last price71.77
Today Daily Change-0.25
Today Daily Change %-0.35%
Today daily open72.02
 
Trends
Daily SMA2072.22
Daily SMA5070.31
Daily SMA10066.48
Daily SMA20057.91
 
Levels
Previous Daily High72.21
Previous Daily Low70.37
Previous Weekly High72
Previous Weekly Low64.99
Previous Monthly High74.17
Previous Monthly Low66.78
Daily Fibonacci 38.2%71.51
Daily Fibonacci 61.8%71.07
Daily Pivot Point S170.85
Daily Pivot Point S269.69
Daily Pivot Point S369.01
Daily Pivot Point R172.69
Daily Pivot Point R273.37
Daily Pivot Point R374.53

Author

Anil Panchal

Anil Panchal

FXStreet

Anil Panchal has nearly 15 years of experience in tracking financial markets. With a keen interest in macroeconomics, Anil aptly tracks global news/updates and stays well-informed about the global financial moves and their implications.

More from Anil Panchal
Share:

Markets move fast. We move first.

Orange Juice Newsletter brings you expert driven insights - not headlines. Every day on your inbox.

By subscribing you agree to our Terms and conditions.

Editor's Picks

EUR/USD climbs toward 1.1800 on broad USD weakness

EUR/USD gathers bullish momentum and advances toward 1.1800 in the second half of the day on Tuesday. The US Dollar weakens and helps the pair stretch higher after the employment report showed that Nonfarm Payrolls declined by 105,000 in October before rising by 64,000 in November.

GBP/USD climbs to fresh two-month high above 1.3400

GBP/USD gains traction in the American session and trades at its highest level since mid-October above 1.3430. The British Pound benefits from upbeat PMI data, while the US Dollar struggles to find demand following the mixed employment figures and weaker-than-forecast PMI prints, allowing the pair to march north.

Gold extends its consolidative phase around $4,300

Gold trades in positive above $4,300 after spending the first half of the day under bearish pressure. XAU/USD capitalizes on renewed USD weakness after the jobs report showed that the Unemployment Rate climbed to 4.6% in November and the PMI data revealed a loss of growth momentum in the private sector in December. 

US Retail Sales virtually unchanged at $732.6 billion in October

Retail Sales in the United States were virtually unchanged at $732.6 billion in October, the US Census Bureau reported on Tuesday. This print followed the 0.1% increase (revised from 0.3%) recorded in September and came in below the market expectation of +0.1%.

Ukraine-Russia in the spotlight once again

Since the start of the week, gold’s price has moved lower, but has yet to erase the gains made last week. In today’s report we intend to focus on the newest round of peace talks between Russia and Ukraine, whilst noting the release of the US Employment data later on day and end our report with an update in regards to the tensions brewing in Venezuela.

BNB Price Forecast: BNB slips below $855 as bearish on-chain signals and momentum indicators turn negative

BNB, formerly known as Binance Coin, continues to trade down around $855 at the time of writing on Tuesday, after a slight decline the previous day. Bearish sentiment further strengthens as BNB’s on-chain and derivatives data show rising retail activity.