|

WTI Price Analysis: Flirts with $51.00 inside immediate rising wedge

  • WTI bulls struggle to keep the reins inside short-term bearish chart formation.
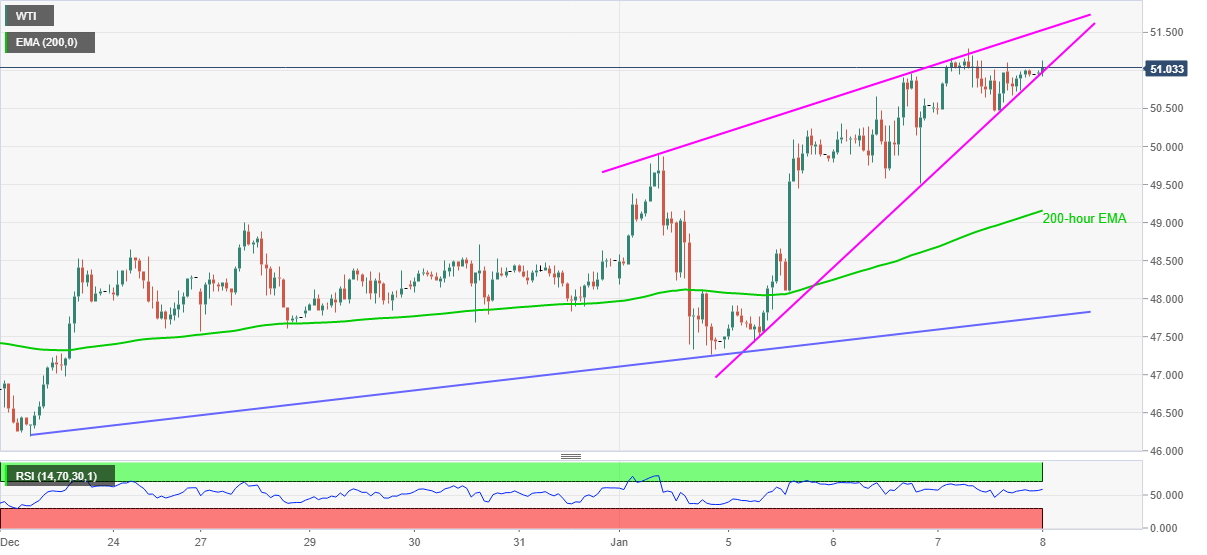
  • Sellers can target 200-hour EMA during fresh declines, oil bulls keep February 2020 top on radar.

WTI wavers around $51.00, currently up 0.10 intraday, during Friday’s Asian session. In doing so, the oil benchmark stays near the highest levels in 11 months while also portraying a bearish chart pattern on the hourly (1h) play.

Given the normal RSI conditions and a lack of immediate upside barrier, WTI is likely to stay positive for a while inside the stated chart formation.

However, any downside break of $50.95 will not hesitate to recall the sellers targeting the 200-hour EMA level of $49.15. During the fall, the $50.00 psychological magnet will be important.

Should the oil bears dominate past-$49.15, an ascending trend line from December 23, at $47.75 now, will be in the spotlight.

Meanwhile, the recently flashed multi-day high of $51.30 can offer immediate resistance to the quote ahead of directing it to the stated pattern’s upper line near $51.55.

If at all the WTI bulls defy the bearish chart pattern by clearing $51.55, February 2020 top near $54.70 will be their favorite.

WTI hourly chart

Trend: Pullback expected

additional important levels

Overview
Today last price51.02
Today Daily Change0.02
Today Daily Change %0.04%
Today daily open51
 
Trends
Daily SMA2048.34
Daily SMA5044.88
Daily SMA10042.55
Daily SMA20038.52
 
Levels
Previous Daily High51.3
Previous Daily Low50.34
Previous Weekly High49
Previous Weekly Low47.57
Previous Monthly High49.43
Previous Monthly Low44.01
Daily Fibonacci 38.2%50.93
Daily Fibonacci 61.8%50.7
Daily Pivot Point S150.46
Daily Pivot Point S249.92
Daily Pivot Point S349.5
Daily Pivot Point R151.42
Daily Pivot Point R251.84
Daily Pivot Point R352.38

Author

Anil Panchal

Anil Panchal

FXStreet

Anil Panchal has nearly 15 years of experience in tracking financial markets. With a keen interest in macroeconomics, Anil aptly tracks global news/updates and stays well-informed about the global financial moves and their implications.

More from Anil Panchal
Share:

Editor's Picks

EUR/USD struggles to build on recent rebound, holds above 1.1550

EUR/USD trades marginally lower on the day but holds above 1.1550 in the American session, following Thursday's rebound. The pair holds near its intraday high as the US Dollar remains pressured by hopes the Middle East conflict will soon come to an end.

GBP/USD hovers around 1.3400 as investors await war clarity

GBP/USD remains near its daily open, not far from 1.3400, in the second half of Friday's session. The US Dollar lost its previous intraday strength and weakens as investors await clarity on the US-Iran war.

Gold stabilizes above $4,200 as wait-and-see continues

After rising more than 3% on Thursday, Gold (XAU/USD) stabilized around the $4,200 mark in the American session on Friday. The US dollar seesaws between gains and losses, but remains within familiar levels as investors remain skeptical yet hopeful about a resolution to the Middle East conflict.

Crypto Today: Bitcoin, Ethereum, XRP recovery slows amid incessant capital outflows

The cryptocurrency remains in a broader corrective bias on Friday, despite majors such as Bitcoin (BTC), Ethereum (ETH), and Ripple (XRP) holding slightly higher than early-week support levels.

SpaceX launches 24% higher at Friday debut
Space Exploration Technologies (SPCX), aka SpaceX, zoomed 24% higher soon after the start of its first IPO trading day on Friday. Shares of the rocket and artificial intelligence (AI) company founded by Elon Musk began trading at about 11:46 am EST and quickly gained speed.
4.2% headline, 0.2% core: Why the Fed's next hike may be targeting the wrong problem

May's CPI put headline inflation at 4.2% on the year, up from 3.8% in April and the hottest reading since April 2023, while core prices rose just 0.2% on the month, undershooting the 0.3% consensus and halving April's pace.