|

WTI Price Analysis: Escalates recovery moves to fill the gap below $41.20

  • WTI extends pullback from the multi-year low.
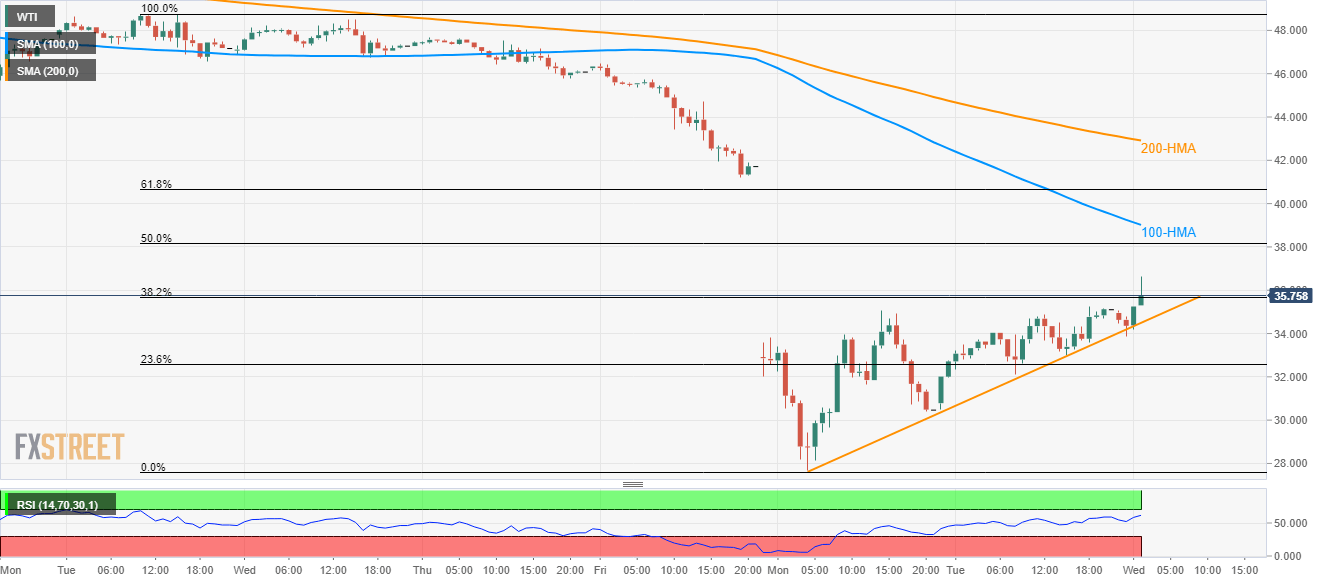
  • 100-HMA, 61.8% of Fibonacci retracement can offer intermediate halts to revisit the previous week’s closing.
  • An ascending trend line since Monday limits immediate downside.

While following a short-term rising trend line from Monday, WTI takes the bids to $35.70 during the Asian session on Wednesday.

In doing so, the energy benchmark rises towards filling the week-start gap below $41.20. However, 100-Hour Simple Moving Average (HMA) near $39.00 can act as immediate resistance.

Following that 61.8% Fibonacci retracement of the black gold’s monthly declines, at $40.65 can act as an additional upside barrier.

It should, however, be noted that a 200-HMA level of $42.90 can challenge the oil price recovery beyond $41.20.

Meanwhile, a sustained decline below the immediate support line of $34.50 can take rest near $30.00 ahead of challenging the previous week’s low surrounding $28.80.

WTI hourly chart

Trend: Further recovery expected

Additional important levels

Overview
Today last price35.70
Today Daily Change0.30
Today Daily Change %0.85%
Today daily open35.12
 
Trends
Daily SMA2047.94
Daily SMA5052.8
Daily SMA10055.34
Daily SMA20055.53
 
Levels
Previous Daily High35.26
Previous Daily Low30.48
Previous Weekly High48.74
Previous Weekly Low41.22
Previous Monthly High54.69
Previous Monthly Low43.95
Daily Fibonacci 38.2%33.44
Daily Fibonacci 61.8%32.31
Daily Pivot Point S131.98
Daily Pivot Point S228.84
Daily Pivot Point S327.2
Daily Pivot Point R136.76
Daily Pivot Point R238.4
Daily Pivot Point R341.54

Author

Anil Panchal

Anil Panchal

FXStreet

Anil Panchal has nearly 15 years of experience in tracking financial markets. With a keen interest in macroeconomics, Anil aptly tracks global news/updates and stays well-informed about the global financial moves and their implications.

More from Anil Panchal
Share:

Editor's Picks

EUR/USD looks to regain the 200-day SMA

EUR/USD regains some balance and trade just above 1.1600 the figure ahead of the opening bell in Asia. The pair initially dipped to the 1.1530 zone for the first time since November, always following the stronger US Dollar and the marked flight-to-safety in the context of the ongoing Middle East crisis
 

GBP/USD slips below key averages as geopolitical risks mount

GBP/USD fell about 0.35% on Tuesday, settling around 1.3350 after slipping below the 200-day Exponential Moving Average for the first time since early December. The pair has pulled back sharply from its late-January high near 1.3870, shedding over 500 pips in a series of lower highs and lower lows. 

Gold falls to near $5,100 as inflation fears weigh amidst Middle East conflict

Gold price faces some selling pressure near $5,100 during the early Asian session on Wednesday. The precious metal falls amid a renewed US Dollar demand and dimming prospects for US rate cuts. The US ISM Services Purchasing Managers Index report will be published later on Wednesday. 

Ethereum: Whales step up buying as short positions contract

After holding firm heading into the last weekend, Ethereum whales have returned to action, pouncing on the volatility stemming from escalating military actions between the US and Iran.

Energy shock 2.0: Why rising Gas prices could hit the Euro

Even without a confirmed, sustained disruption, the mere risk to a key global energy chokepoint is enough to inject a significant premium into European Gas markets. And for the Euro, that matters.

Ripple falters amid sell-off jitters and negative funding rates

Ripple (XRP) has come under pressure, drifting lower to $1.35 at the time of writing on Tuesday. The over 2% correction looks poised to erase the previous day’s gains, which lifted the remittance token to $1.42.