|

WTI Price Analysis: Bulls press against daily trendline resistance, bears are lurking

  • WTI M-formation is in play in thin choppy trade on Monday. 
  • Daily chart parameters keep the price stuck in a range, testing daily trendline resistance. 

Oil has fallen in thin trade at the start of the week with US exchanges closed for the Martin Luther King, Jr, holiday. West Texas Intermediate spot is currently trading around $79.00 and is down by 1.25%.

Technically, the M-formation on the hourtly chart is a reversion pattern that would be expected to draw in the price into the Fibonacci scale drawn on the prior bearish impulse's range. The 38.2% Fibo aligns with a structure near 79.15 that could act as a resistance on a restest.

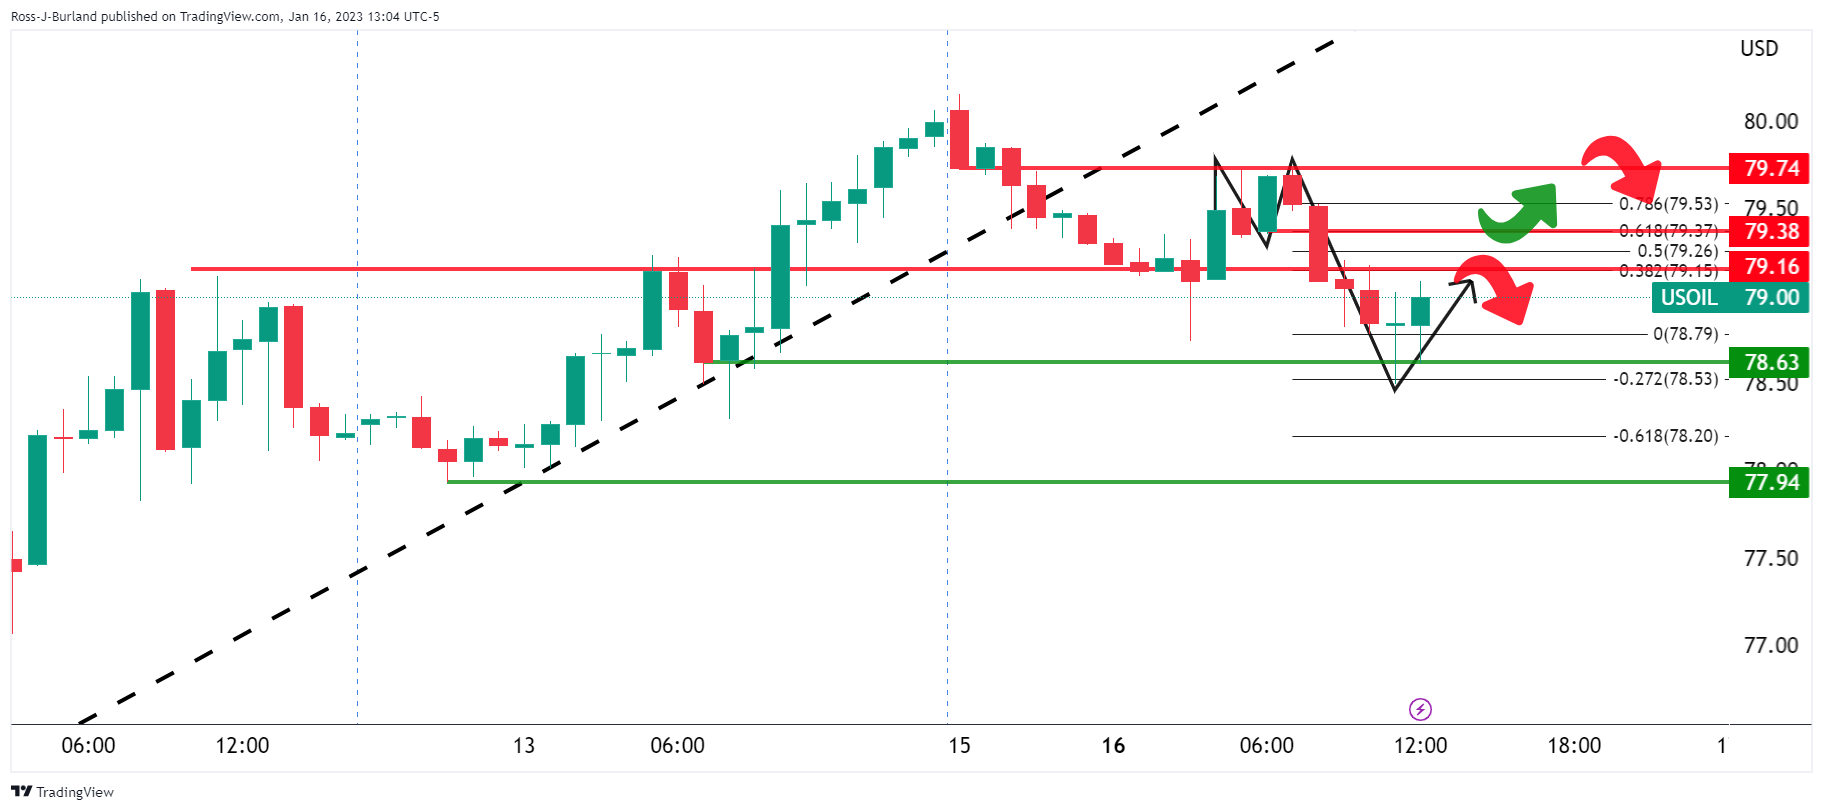
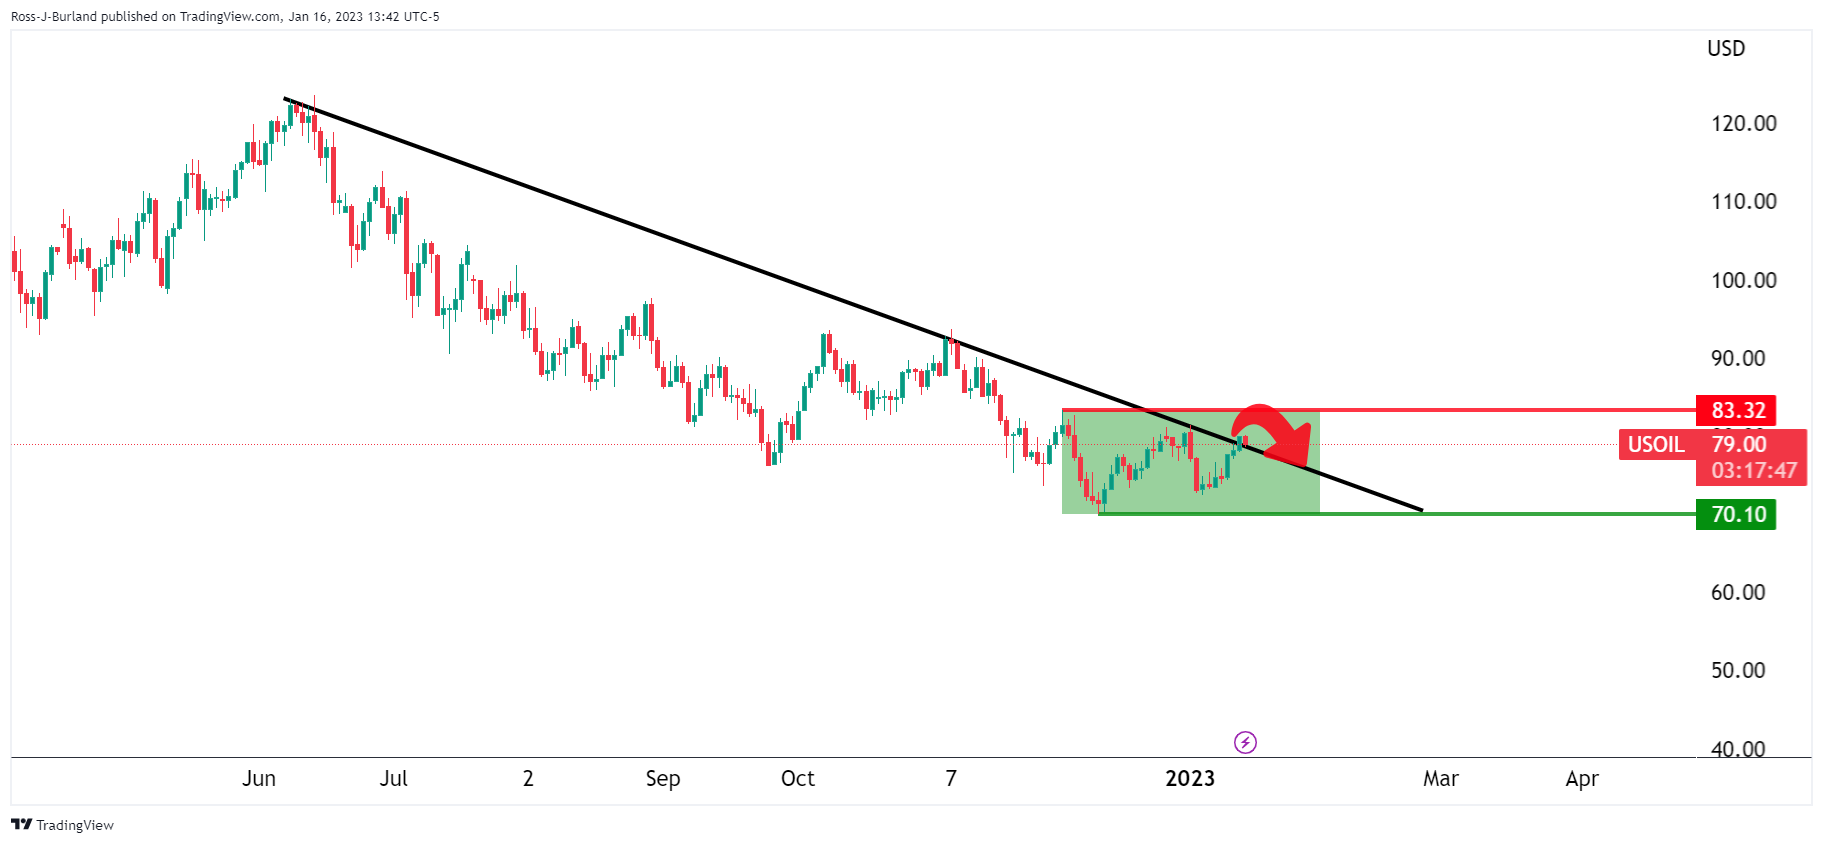
If the price were to break there, then a 50% mean reversion will be a likely scenario ahead of the 61.8% Fibonacci that meets the neckline of the M-pattern near 79.38. Above there, the double top of the M-formation comes in at around 79.75. Stops above there will be located around 80.00. However, given that the market is on the backside of the bullish trend, the downside will remain favourable until the bulls can break above 83.32 daily highs and structure:

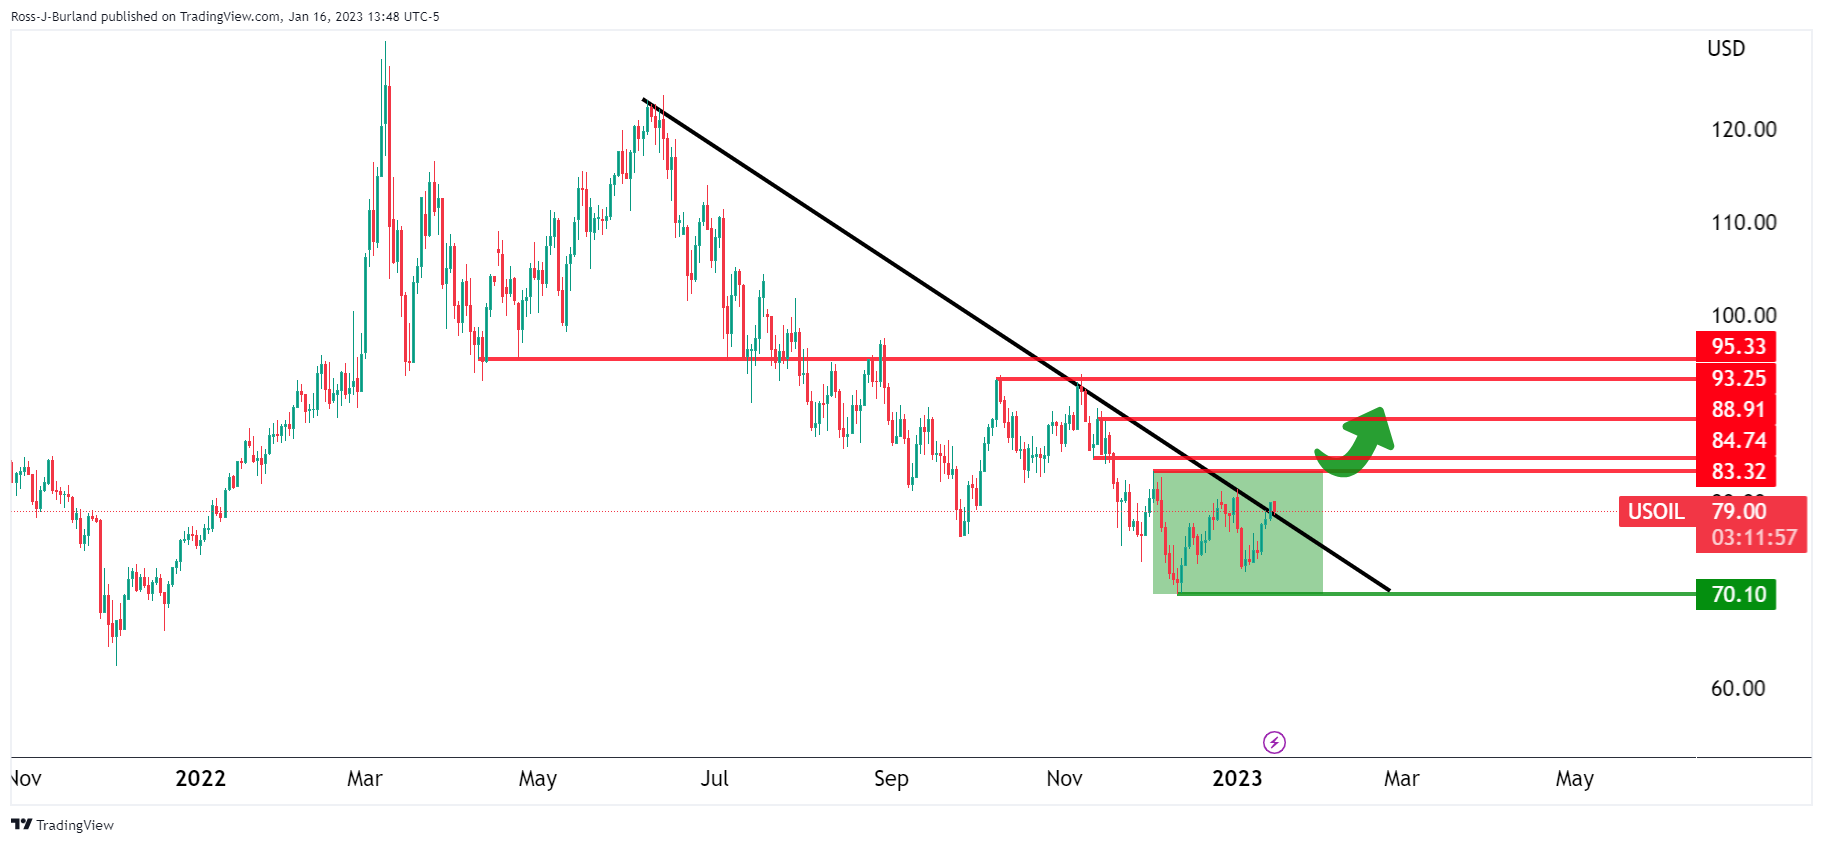
On the other hand, a break of structure opens risk to a run towards 93.25 / 95.33 and higher in a correction of the 2022 summer commencing bearish cycle:

Author

Ross J Burland

Ross J Burland, born in England, UK, is a sportsman at heart. He played Rugby and Judo for his county, Kent and the South East of England Rugby team.

More from Ross J Burland
Share:

Markets move fast. We move first.

Orange Juice Newsletter brings you expert driven insights - not headlines. Every day on your inbox.

By subscribing you agree to our Terms and conditions.

Editor's Picks

EUR/USD holds around 1.1750 after weak German and EU PMI data

EUR/USD maintains its range trade at around 1.1750 in European trading on Tuesday. Weaker-than-expected December PMI data from Germany and the Eurozone make it difficult for the Euro to find demand, while investors refrain from taking large USD positions ahead of key employment data.

GBP/USD climbs above 1.3400 after upbeat UK PMI data

GBP/USD gains traction and trades in positive territory above 1.3400 on Tuesday as the British Pound benefits from upbeat PMI data. Later in the day, crucial data releases from the US, including Nonfarm Payrolls, Retail Sales and PMI, could trigger the next big action in the pair.

Gold retreats from seven week highs on profit-taking; all eyes on US NFP release

Gold price loses momentum below $4,300 during the early European trading hours on Tuesday, pressured by some profit-taking and weak long liquidation from the shorter-term futures traders. Furthermore, optimism around Ukraine peace talks could weigh on the safe-haven asset like Gold.

US Nonfarm Payrolls expected to point to cooling labor market in November

The United States Bureau of Labor Statistics will release the delayed Nonfarm Payrolls (NFP) data for October and November on Tuesday at 13:30 GMT. Economists expect Nonfarm Payrolls to rise by 40,000 in November. The Unemployment Rate is likely to remain unchanged at 4.4% during the same period.

NFP preview: Complex data release will determine if Fed was right to cut rates

The long wait is over, and the Bureau of Labor Statistics in the US will release nonfarm payrolls reports for both November and October at 1330 GMT on Tuesday. The overall NFP figure for October is expected to be -10k, however, it is expected to be influenced by a massive 130k drop in federal department workers. 

BNB Price Forecast: BNB slips below $855 as bearish on-chain signals and momentum indicators turn negative

BNB, formerly known as Binance Coin, continues to trade down around $855 at the time of writing on Tuesday, after a slight decline the previous day. Bearish sentiment further strengthens as BNB’s on-chain and derivatives data show rising retail activity.