|

WTI Price Analysis: Bears firming up the grip towards immediate support lines under $40.00

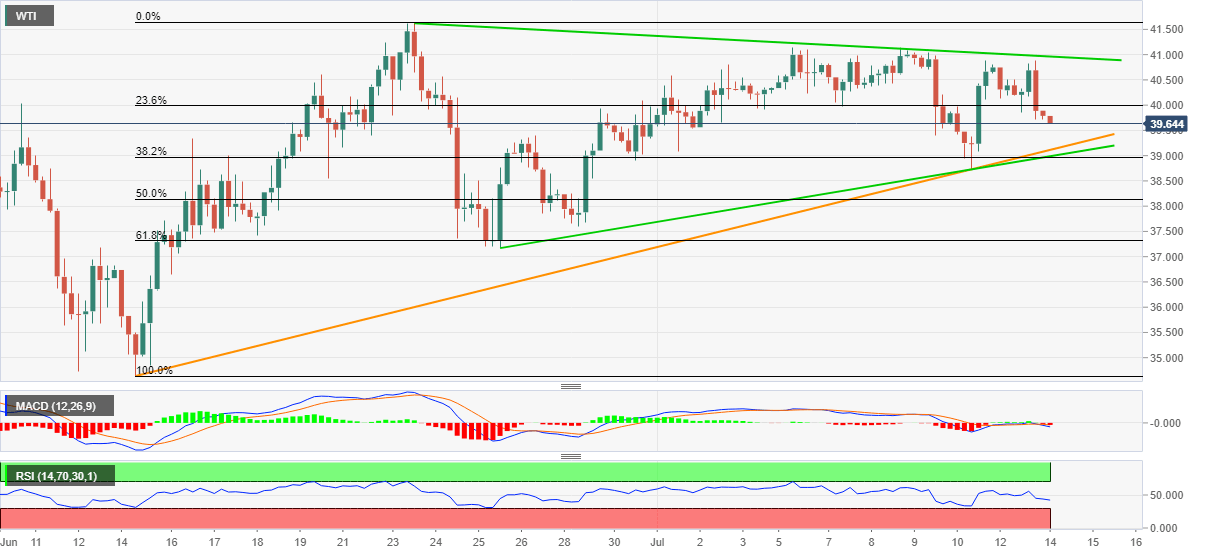
  • WTI stays on the back foot after taking a U-turn from $40.87 the previous day.
  • An ascending trend line from June 25, monthly support line are on the sellers’ radars.
  • A three-week-old falling trend line restricts the pair’s immediate upside.

WTI drops to $39.70, down 0.20%, during the initial hour of Tokyo open on Tuesday. In doing so, the energy benchmark extends Monday’s weakness from $40.87 amid bearish MACD signals.

However, two short-term ascending trend lines, surrounding $39.10 and $39.00 respectively, seem to restrict the black gold’s further weakness.

If at all the oil prices slip below $39.00, 61.8% Fibonacci retracement of June 15-23 upside near $37.30 will be the key to follow.

On the upside, $40.00 and $40.20 can offer immediate resistance to the quote ahead of highlighting a downward sloping trend line from June 23, at $41.00 now.

It’s worth mentioning that the buyers’ ability to conquer $41.00 enables them to challenge the previous month’s top close to $41.65 with eyes on February month low near $44.00 during the further upside.

WTI four-hour chart

Trend: Further weakness expected

Additional important levels

Overview
Today last price39.72
Today Daily Change-0.07
Today Daily Change %-0.18%
Today daily open39.79
 
Trends
Daily SMA2039.66
Daily SMA5035.56
Daily SMA10032.65
Daily SMA20044.51
 
Levels
Previous Daily High40.87
Previous Daily Low39.71
Previous Weekly High41.14
Previous Weekly Low38.73
Previous Monthly High41.65
Previous Monthly Low34.45
Daily Fibonacci 38.2%40.16
Daily Fibonacci 61.8%40.43
Daily Pivot Point S139.38
Daily Pivot Point S238.97
Daily Pivot Point S338.22
Daily Pivot Point R140.54
Daily Pivot Point R241.29
Daily Pivot Point R341.7

Author

Anil Panchal

Anil Panchal

FXStreet

Anil Panchal has nearly 15 years of experience in tracking financial markets. With a keen interest in macroeconomics, Anil aptly tracks global news/updates and stays well-informed about the global financial moves and their implications.

More from Anil Panchal
Share:

Editor's Picks

EUR/USD looks weak below 1.1800

EUR/USD has slipped back under pressure, breaking through the 1.1800 support and drifting towards the weekly lows near 1.1770 ahead of the opening bell in Asia. The move reflects renewed strength in the US Dollar, with steady geopolitical tensions keeping its demand firm. Moving forward, the release of the German labour market report and flash inflation figures should keep European investors entertained on Friday.
 

GBP/USD threatens the 200-day SMA near 1.3440

GBP/USD rapidly leaves behind Wednesday’s strong advance, coming under heavy pressure and retesting the 1.3440 zone, where the critical 200-day SMA is located. Cable’s deep pullback follows the strong gains in the Greenback, while investors continue to pencil in a potential BoE rate cut in March.

Gold trims gains, slips back to around $5,170

Gold is now facing some downside pressure, hovering around the $5,170 region on Thursday. The yellow metal surrenders part of its earlier gains on the back of the resurgence of the buying interest in the Greenback. In the meantime, geopolitical tensions in the Middle East continue to limit the downside potential for now.

How AI, blockchain, stablecoins are shaping a new global economy – Circle CEO Jeremy Allaire

Artificial Intelligence (AI), blockchain technology and stablecoins are emerging as core pillars of a new global economic system, according to Circle’s CEO, Jeremy Allaire.

Changing the game: International implications of recent tariff developments

The Supreme Court ruling on International Emergency Economic Powers Act (IEEPA) tariffs provides limited relief for the rest of the world, with weighted average tariff rates modestly lower.

Bitcoin steadies as traders eye US–Iran talks

Bitcoin (BTC) price is stabilizing around $68,000 at the time of writing on Thursday after a 6.2% relief rally the previous day amid a broader downward trend.