|

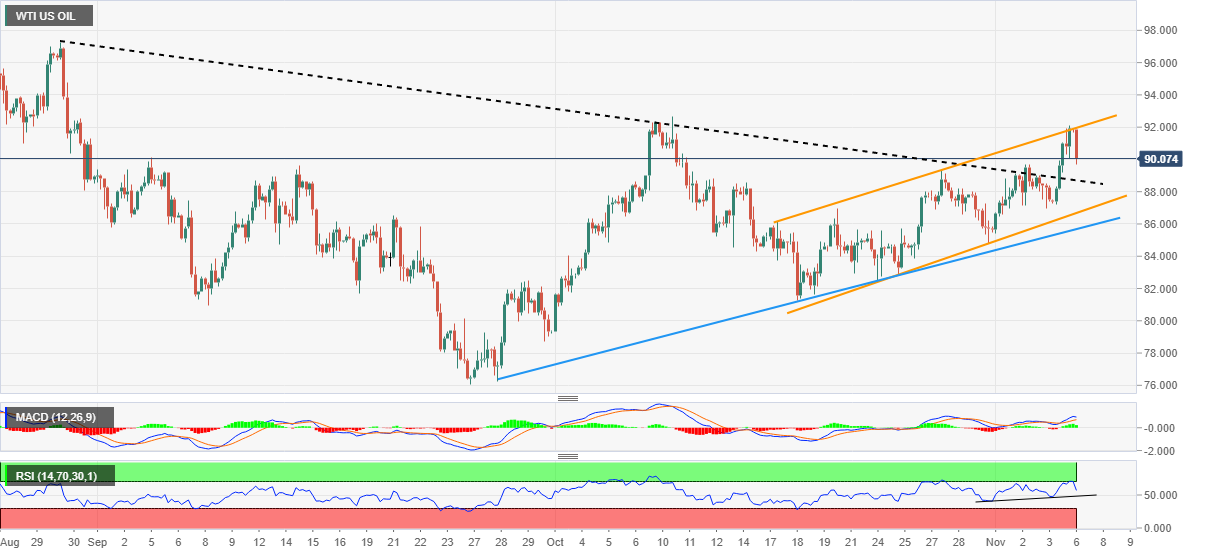
WTI Price Analysis: Bears attack $90.00 inside three-week-old rising channel

  • WTI pares the biggest daily gains in six months by retreating from a one-month high.
  • Resistance-turned-support line from August restricts immediate declines, five-week-long ascending trend line adds to the downside filters.
  • Oscillators suggest further weakness but bullish chart formation, key support line challenge bears.

WTI Crude Oil holds lower ground near $90.00, following a downside gap to begin the week’s trading. Even so, the black gold remains inside a short-term upward-sloping trend channel during the initial hours of trading on Monday.

It should be noted, however, that the retreat in RSI (14) from the overbought territory and the recently easing bullish MACD signals suggest the energy benchmark’s further weakness.

That said, the previous resistance line from August 30, around $88.60 by the press time, restricts the quote’s immediate downside.

Following that, the support line of the aforementioned bullish channel stretched from mid-October, around $86.80 at the latest, should lure the WTI bears.

It’s worth observing that an upward-sloping support line from September 28, close to $85.70, acts as an extra filter to the south before welcoming the oil sellers.

Alternatively, recovery moves may aim for the stated channel’s upper line, close to $92.00, but the buyers could wait for a clear upside break of the previous monthly peak of $92.63 to retake control.

In that case, a run-up towards the high marked in late August, around $97.30, might gain the market’s attention.

WTI: Four-hour chart

Trend: Limited downside expected

Additional important levels

Overview
Today last price90.08
Today Daily Change-1.77
Today Daily Change %-1.93%
Today daily open91.85
 
Trends
Daily SMA2086.64
Daily SMA5085.77
Daily SMA10091.26
Daily SMA20097.44
 
Levels
Previous Daily High92.09
Previous Daily Low87.2
Previous Weekly High92.09
Previous Weekly Low84.78
Previous Monthly High92.63
Previous Monthly Low79.32
Daily Fibonacci 38.2%90.22
Daily Fibonacci 61.8%89.07
Daily Pivot Point S188.67
Daily Pivot Point S285.49
Daily Pivot Point S383.79
Daily Pivot Point R193.56
Daily Pivot Point R295.27
Daily Pivot Point R398.44

Author

Anil Panchal

Anil Panchal

FXStreet

Anil Panchal has nearly 15 years of experience in tracking financial markets. With a keen interest in macroeconomics, Anil aptly tracks global news/updates and stays well-informed about the global financial moves and their implications.

More from Anil Panchal
Share:

Markets move fast. We move first.

Orange Juice Newsletter brings you expert driven insights - not headlines. Every day on your inbox.

By subscribing you agree to our Terms and conditions.

Editor's Picks

EUR/USD eases toward 1.1700 as USD recovers

EUR/USD stays on the back foot and declines toward 1.1700 on Friday. The pair faces headwinds from a renewed uptick in the US Dollar as investors look past softer US inflation data. However, the EUR/USD downside appears capped by expectations of the Fed-ECB monetary policy divergence. 

GBP/USD steadies below 1.3400 as traders assess BoE policy outlook

Following Thursday's volatile session, GBP/USD moves sideways below 1.3400 on Friday. Investors reassess the Bank of England's policy oıtlook after the MPC decided to cut the interest rate by 25 bps by a slim margin. Meanwhile, the US Dollar benefits from the cautious market stance, limiting the pair's upside.

Gold stays weak below $4,350 as USD bulls shrug off softer US CPI

Gold holds the previous day's late pullback from the vicinity of the record high and stays in the red below $4,350 in the European session on Friday. The US CPI report released on Thursday pointed to cooling inflationary pressures, but the US Dollar seems resilient amid a fresh bout of short-covering.

Bitcoin, Ethereum and Ripple correction slide as BoJ rate decision weighs on sentiment

Bitcoin, Ethereum, and Ripple are extending their correction phases after losing nearly 3%, 8%, and 10%, respectively, through Friday. The pullback phase is further strengthened as the upcoming Bank of Japan’s rate decision on Friday weighs on risk sentiment, with BTC breaking key support, ETH deepening weekly losses, and XRP sliding to multi-month lows.

How much can one month of soft inflation change the Fed’s mind?

One month of softer inflation data is rarely enough to shift Federal Reserve policy on its own, but in a market highly sensitive to every data point, even a single reading can reshape expectations. November’s inflation report offered a welcome sign of cooling price pressures. 

Ethereum Price Forecast: EF outlines ways to solve growing state issues

Ethereum price today: $2,920. The EF noted that Ethereum's growing state could lead to centralization and weaken censorship resistance. The Stateless Consensus team outlined state expiry, state archive and partial statelessness as potential solutions to the growing state load.