WTI Price Analysis: Bearish impulse looks set to retest $65.00
- WTI remains pressured after breaking weekly support line.
- Bearish impulse, failures to cross the key hurdles favor sellers.

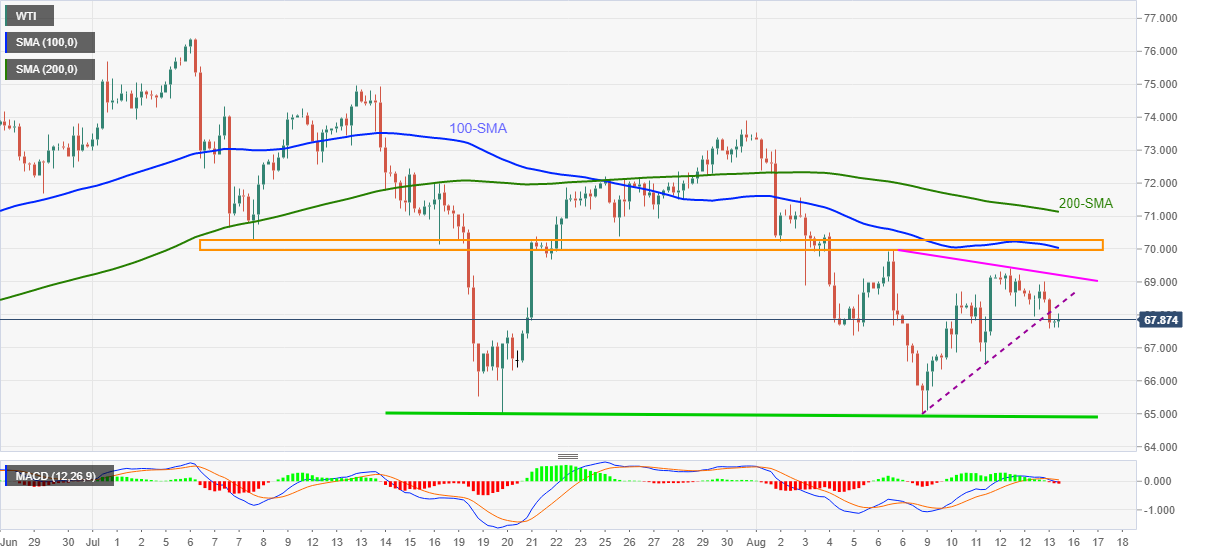
WTI holds onto the last two days’ downbeat performance, recently pressured to $67.85 amid Monday’s Asian session. The black gold broke a one-week-old rising support line, now resistance, the previous day.
The trend line breakdown gains extra support from bearish MACD signals and the commodity’s sustained trading below the key SMAs and horizontal resistance.
Hence, the WTI bears are on the driver’s seat towards the double-bottom surrounding $65.00. However, $67.40 and $66.00 may offer intermediate halts during the fall.
In a case where the oil sellers keep reins past $65.00, May’s low surrounding $61.50 should return to the charts.
On the flip side, the resistance-turned-support precedes a downward sloping trend line from August 06, respectively around $68.25 and $69.20, to challenge WTI’s short-term rebound.
However, a horizontal area comprising multiple levels marked since early July, also including 100-SMA, challenges the quote’s further upside around $70.00–70.30. Also acting as an upside hurdle is the 200-SMA level of $71.12.
WTI: Four-hour chart
Trend: Further weakness expected
Author

Anil Panchal
FXStreet
Anil Panchal has nearly 15 years of experience in tracking financial markets. With a keen interest in macroeconomics, Anil aptly tracks global news/updates and stays well-informed about the global financial moves and their implications.


