WTI Price Analysis: Battles 10-week-old resistance around $77.00
- WTI struggles after rising to the highest level since late November, pauses two-day uptrend.
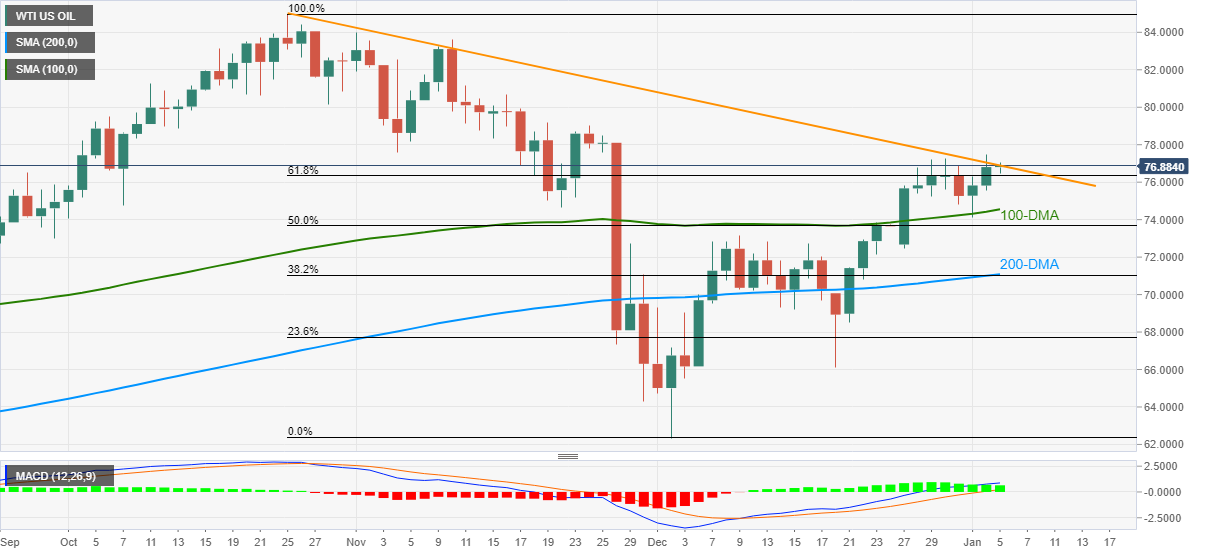
- Successful trading above the key DMAs, bullish MACD signals keep buyers hopeful.

WTI crude oil consolidates early Asian session losses while picking up bids to $76.80 ahead of Wednesday’s European trading bell. In doing so, the black gold battles a downward sloping resistance line from October 25.
Given the firmer MACD signals and the commodity’s ability to stay beyond the 100-DMA, as well as the 200-DMA, the US oil benchmark remains on the bull’s radar.
That said, the short-term descending trend line restricts the quote’s immediate upside around $77.00, a break of which will direct WTI prices towards the late November’s peak near $79.00.
During the commodity’s upside past $79.00, the $80.00 round figure and November 09 top near $83.60 may offer intermediate halts before highlighting October’s peak surrounding $85.00 for the WTI bulls.
On the contrary, 61.8% Fibonacci retracement (Fibo.) of October-December downside, near $76.30, restricts the short-term downside of the commodity ahead of the 100-DMA level of $74.55.
In a case where the oil prices remain weak below $74.55, a convergence of the 200-DMA and 38.2% Fibo. around $71.00 becomes the key for WTI sellers to watch for further control.
WTI: Daily chart
Trend: Further upside expected
Author

Anil Panchal
FXStreet
Anil Panchal has nearly 15 years of experience in tracking financial markets. With a keen interest in macroeconomics, Anil aptly tracks global news/updates and stays well-informed about the global financial moves and their implications.


