|

WTI Price Analysis: 50-SMA prods China data-led recovery around $81.00

  • WTI crude oil clings to mild gains while paring the biggest daily loss in a month.
  • China data adds strength to the corrective bounce in Oil price.
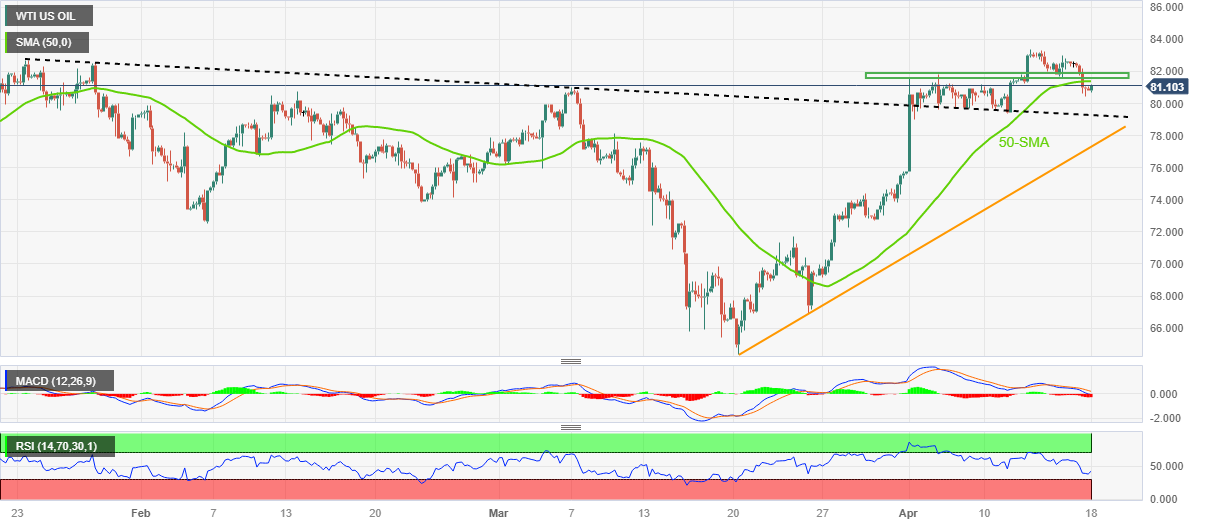
  • Bearish MACD signals, 50-SMA challenges buyers but further downside needs validation from previous resistance line from January.

WTI crude oil stays defensive around the lowest level in one week, near $81.05 during early Tuesday. In doing so, the black gold struggles to cheer China’s upbeat data while consolidating the previous day’s heavy loss, the biggest in one month.

As per the latest economic updates from China’s National Bureau of Statistics (NBS), the first quarter (Q1) Gross Domestic Product (GDP) grows 2.2% QoQ versus the 2.2% expected and 0.0% prior. Further, Retail Sales growth jumps 10.9% YoY in March versus 7.4% expected and 3.5% prior whereas Industrial Production eased below 4.0% expected growth figures to 3.9%, versus 2.4% previous readings.

Apart from the mostly upbeat China data, nearly oversold RSI (14) line also allows the black gold to grind higher, recently approaching the 50-SMA hurdle of around $81.40.

It’s worth noting, however, that the bearish MACD signals and a two-week-old horizontal resistance area around $81.60-80, could challenge the commodity’s further upside. Following that, the recent multi-day high marked in the last week, around $83.40 will be in focus.

On the contrary, WTI’s further downside can aim for the $80.00 round figure ahead of challenging previous resistance line from late January, now support close to $79.20.

Should the quote remains bearish past $79.20, an upward-sloping support line from March 20, near $77.30, acts as the last defense of the WTI bulls.

WTI: Four-hour chart

Trend: Limited downside expected

Additional important levels

Overview
Today last price81.04
Today Daily Change0.09
Today Daily Change %0.11%
Today daily open80.95
 
Trends
Daily SMA2076.41
Daily SMA5076.29
Daily SMA10076.97
Daily SMA20082.49
 
Levels
Previous Daily High82.61
Previous Daily Low80.45
Previous Weekly High83.4
Previous Weekly Low79.4
Previous Monthly High80.99
Previous Monthly Low64.39
Daily Fibonacci 38.2%81.28
Daily Fibonacci 61.8%81.79
Daily Pivot Point S180.06
Daily Pivot Point S279.18
Daily Pivot Point S377.9
Daily Pivot Point R182.22
Daily Pivot Point R283.5
Daily Pivot Point R384.38

Author

Anil Panchal

Anil Panchal

FXStreet

Anil Panchal has nearly 15 years of experience in tracking financial markets. With a keen interest in macroeconomics, Anil aptly tracks global news/updates and stays well-informed about the global financial moves and their implications.

More from Anil Panchal
Share:

Editor's Picks

GBP/USD drops to multi-month troughs near 1.3140

GBP/USD adds to Tuesday’s pullback and recedes to the lowest level since November 2025 near 1.3140. A firmer Greenback and continued political turmoil in the UK are keeping Cable under persistent pressure, with little sign of a meaningful recovery.

EUR/USD bounces off YTD lows around 1.1320

EUR/USD extends its decline on Wednesday, falling to fresh yearly lows near 1.1320. The pair remains on the defensive as the US Dollar continues to draw support from hawkish Fed expectations and uncertainty over the outcome of US-Iran peace negotiations.

Gold trims losses, back above $4,000

Gold retreats further and breaches below the key $4,000 mark per troy ounce for the first time since November 2025 on Wednesday. Higher-for-longer Fed expectations and a broadly firmer US Dollar continue to weigh on the precious metal, while uncertainty surrounding a potential US-Iran peace agreement has done little to revive demand for the safe haven space.

Crypto Today: Bitcoin, Ethereum, XRP trade under pressure as September Fed rate-hike odds increase

Bitcoin is trading between $62,000 and $63,000 at the time of writing on Wednesday, weighed down by headwinds stemming from macroeconomic uncertainty and geopolitical tensions in the Middle East.

5.90% to 5.45%: Why the Pound ignored the bond market’s relief rally

Keir Starmer resigned on Monday, and the Pound barely moved. That near-silence is the tell. Sterling's real driver these past four months has not been the prime minister, nor the left-leaning frontrunner lining up to replace him, but the long end of the gilt curve, which answers to a force no British politician controls.

Regime change: Inside Kevin Warsh's first move to make the Fed unreadable on purpose

The rate did not move. That was the least interesting thing about Kevin Warsh's first meeting in charge of the Fed. The FOMC held its benchmark at 3.50%-3.75% for the fourth straight meeting, exactly as priced, and then the new chair used his first press conference to dismantle the machinery the market has leaned on for a decade.