WTI Price Analysis: 200-hour EMA probes the bulls cheering API inventory draw
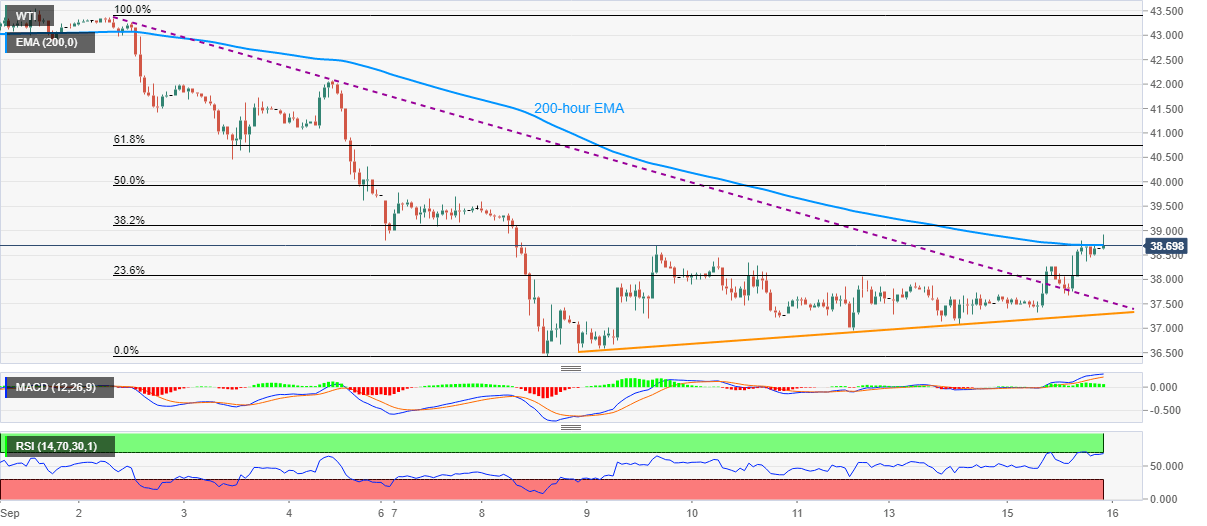
- WTI awaits fresh clues after refreshing one week high to $38.91.
- API Weekly Crude Oil Stock dropped 9.517 million barrels in the week ended on September 11.
- Overbought RSI also challenges the run-up following the break of the monthly falling trend line.

WTI eases from intraday high, also the one week top, while taking rounds to $38.70 during the initial Asian trading on Wednesday. The energy benchmark earlier benefited from the weekly inventory data from the American Petroleum Institute (API). However, 200-hour EMA restricts the commodity’s immediate upside amid overbought RSI conditions.
The weekly Crude Oil Stocks have depleted 9.517 million barrels, versus the previous addition of 2.97 million barrels, as per the latest API data.
Considering the WTI’s inability to overcome important EMA resistance amid overbought RSI, odds of its pullback to $38.00 can’t be ruled out. However, a descending trend line from September 02, previous resistance, may question the quote’s further downside around $37.57.
Also acting as a downside barrier is the one-week-old upward sloping support line near $37.28.
In a case the bulls refrain from respecting the RSI conditions and successfully cross the $38.70 immediate resistance, $39.80 and $40.00 will regain market attention.
It should also be noted that the barrel of oil may target 61.8% Fibonacci retracement of its fall during September 02-08, around $40.75 level, during the rise beyond $40.00.
WTI hourly chart
Trend: Pullback expected
Author

Anil Panchal
FXStreet
Anil Panchal has nearly 15 years of experience in tracking financial markets. With a keen interest in macroeconomics, Anil aptly tracks global news/updates and stays well-informed about the global financial moves and their implications.


