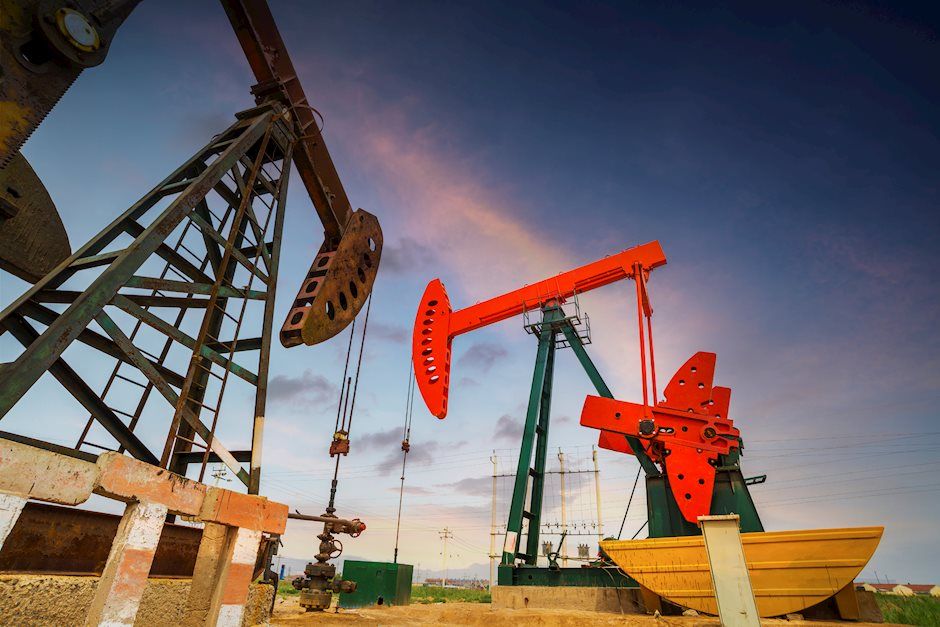
WTI on the front foot after Chinese PMI, eyes on API data


  • WTI benefits from upbeat Chinese data, moves off lows.
  • Risk sentiment remains sluggish with US bond yields retracing earlier gains, Asian stocks mixed.
  • API data, coronavirus headlines eyed for fresh impulse.

WTI extends its pullback move from the 17-year low while trading near $21.00 ahead of the European session on Tuesday. China’s March month official PMIs accelerated the black gold’s recovery from the multi-year bottom whereas risk reset also offered additional help.

China’s official Manufacturing PMI crossed 45 forecast and 35.7 prior with 52.00 whereas the Non-Manufacturing gauge surged to 52.3 compared to 37.8 expected and 29.6 earlier reading.

Considering the risk headlines, US President Donald Trump’s ruling out of the nationwide lockdown and upbeat comments in the South China Morning Post (SCMP), stating that China has seemingly gotten the virus outbreak under control, favored the risk assets.

Even so, concerns about the spread of the deadly virus are still stronger to keep some of the Asian stocks under pressure while the US 10-year treasury yields take rounds to 0.70%.

Moving on, the American Petroleum Institute’s (API) weekly private inventory data, up for publishing around 20:30 GMT, prior -1.25M, will be important. Also on the oil traders’ radars will be the supply side news and virus updates.

It’s worth mentioning that US President Donald Trump talked to his Russian counterpart the previous day and both sides, as per Fox News, agreed on the importance of stability in global energy markets. However, no major solution to the Saudi-Russian rift has been suggested, which could keep weighing on the energy prices coupled with the pandemic.

Technical analysis

The bulls are less likely to return, even for short-term, unless prices cross the previous week high beyond $25.00.

Additional important levels

Overview
Today last price 22.93
Today Daily Change 0.92
Today Daily Change % 4.18%
Today daily open 22.01
 
Trends
Daily SMA20 30.92
Daily SMA50 43.41
Daily SMA100 51.23
Daily SMA200 53.65
 
Levels
Previous Daily High 22.53
Previous Daily Low 21.01
Previous Weekly High 25.85
Previous Weekly Low 21.19
Previous Monthly High 54.69
Previous Monthly Low 43.95
Daily Fibonacci 38.2% 21.59
Daily Fibonacci 61.8% 21.95
Daily Pivot Point S1 21.17
Daily Pivot Point S2 20.33
Daily Pivot Point S3 19.65
Daily Pivot Point R1 22.69
Daily Pivot Point R2 23.37
Daily Pivot Point R3 24.21


Share: Feed news

Information on these pages contains forward-looking statements that involve risks and uncertainties. Markets and instruments profiled on this page are for informational purposes only and should not in any way come across as a recommendation to buy or sell in these assets. You should do your own thorough research before making any investment decisions. FXStreet does not in any way guarantee that this information is free from mistakes, errors, or material misstatements. It also does not guarantee that this information is of a timely nature. Investing in Open Markets involves a great deal of risk, including the loss of all or a portion of your investment, as well as emotional distress. All risks, losses and costs associated with investing, including total loss of principal, are your responsibility. The views and opinions expressed in this article are those of the authors and do not necessarily reflect the official policy or position of FXStreet nor its advertisers. The author will not be held responsible for information that is found at the end of links posted on this page.

If not otherwise explicitly mentioned in the body of the article, at the time of writing, the author has no position in any stock mentioned in this article and no business relationship with any company mentioned. The author has not received compensation for writing this article, other than from FXStreet.

FXStreet and the author do not provide personalized recommendations. The author makes no representations as to the accuracy, completeness, or suitability of this information. FXStreet and the author will not be liable for any errors, omissions or any losses, injuries or damages arising from this information and its display or use. Errors and omissions excepted.

The author and FXStreet are not registered investment advisors and nothing in this article is intended to be investment advice.

Recommended content


Recommended content

Editors’ Picks

AUD/USD hovers around 0.6500 amid light trading, ahead of US GDP

AUD/USD hovers around 0.6500 amid light trading, ahead of US GDP

AUD/USD is trading close to 0.6500 in Asian trading on Thursday, lacking a clear directional impetus amid an Anzac Day holiday in Australia. Meanwhile, traders stay cautious due ti risk-aversion and ahead of the key US Q1 GDP release. 

AUD/USD News

USD/JPY finds its highest bids since 1990, near 155.50

USD/JPY finds its highest bids since 1990, near 155.50

USD/JPY keeps breaking into its highest chart territory since June of 1990 early Thursday, testing 155.50 for the first time in 34 years as the Japanese Yen remains vulnerable, despite looming Japanese intervention risks. Focus shifts to Thursday's US GDP report and the BoJ decision on Friday. 

USD/JPY News

Gold price treads water near $2,320, awaits US GDP data

Gold price treads water near $2,320, awaits US GDP data

Gold price recovers losses but keeps its range near $2,320 early Thursday. Renewed weakness in the US Dollar and the US Treasury yields allow Gold buyers to breathe a sigh of relief. Gold price stays vulnerable amid Middle East de-escalation, awaiting US Q1 GDP data. 

Gold News

Injective price weakness persists despite over 5.9 million INJ tokens burned

Injective price weakness persists despite over 5.9 million INJ tokens burned

Injective price is trading with a bearish bias, stuck in the lower section of the market range. The bearish outlook abounds despite the network's deflationary efforts to pump the price. Coupled with broader market gloom, INJ token’s doomed days may not be over yet.

Read more

Meta Platforms Earnings: META sinks 10% on lower Q2 revenue guidance Premium

Meta Platforms Earnings: META sinks 10% on lower Q2 revenue guidance

This must be "opposites" week. While Doppelganger Tesla rode horrible misses on Tuesday to a double-digit rally, Meta Platforms produced impressive beats above Wall Street consensus after the close on Wednesday, only to watch the share price collapse by nearly 10%.

Read more

Forex MAJORS

Cryptocurrencies

Signatures