WTI Oil retreats as Middle East tensions ease, Trump holds back military move
- WTI crude pulls back after topping $75.54 on Thursday, pressured by easing geopolitical risk.
- Geneva talks between Iran and EU diplomats signal diplomatic momentum, cooling Strait of Hormuz fears.
- Trump delays decision on direct US involvement, shifting market focus back to supply fundamentals.

West Texas Intermediate (WTI) Crude Oil is trading lower on Friday, slipping to around $73.80 per barrel after touching a high of $75.54 on Thursday.
The decline reflects reduced geopolitical risk following diplomatic talks between Iran and European powers in Geneva, which helped unwind the risk premium built on Middle East tensions.
WTI slips as Geneva diplomacy calms Hormuz fears, Trump delays action
EU diplomats from France, Germany, the UK, and the EU met with Iranian Foreign Minister Abbas Araghchi in the first official engagement since hostilities between Israel and Iran escalated. While no ceasefire agreement was reached, the meeting signaled a mutual preference for diplomacy over confrontation.
That helped calm investor concerns over potential supply disruptions, particularly around the Strait of Hormuz—a key transit point for nearly 20% of global Oil shipments.
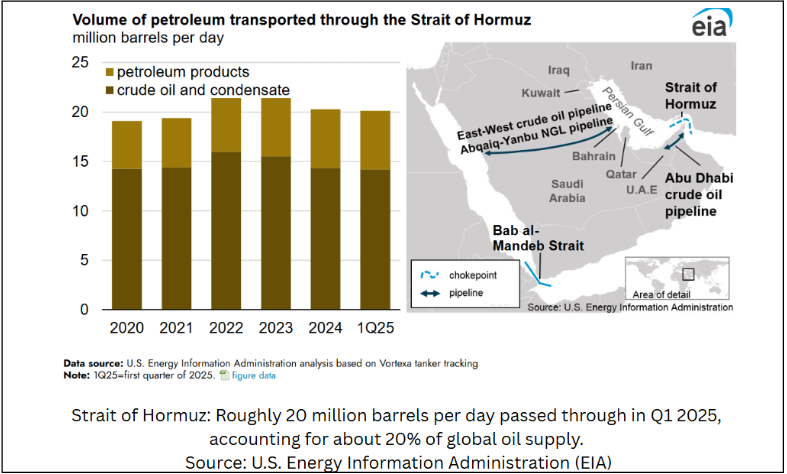
The talks followed remarks from senior Iranian lawmaker Behnam Saeedi, who said Tehran could consider closing the Strait “if vital national interests were at risk,” but stressed it would be a last resort. Although risks remain, the absence of new threats during the Geneva talks has helped ease volatility in crude markets.
At the same time, President Trump delayed a decision on direct US military involvement, shifting market focus back toward supply fundamentals and broader sentiment.
Oil inventory data paints a tighter supply picture
On the data front, US inventory figures released this week added bullish pressure. The American Petroleum Institute (API) reported a draw of 10.13 million barrels for the week, while the Energy Information Administration (EIA) showed an even larger decline of 11.47 million barrels, with both figures far exceeding expectations and indicating tighter supply conditions in the US.
Technical analysis: WTI consolidates after gaining over 22% in June
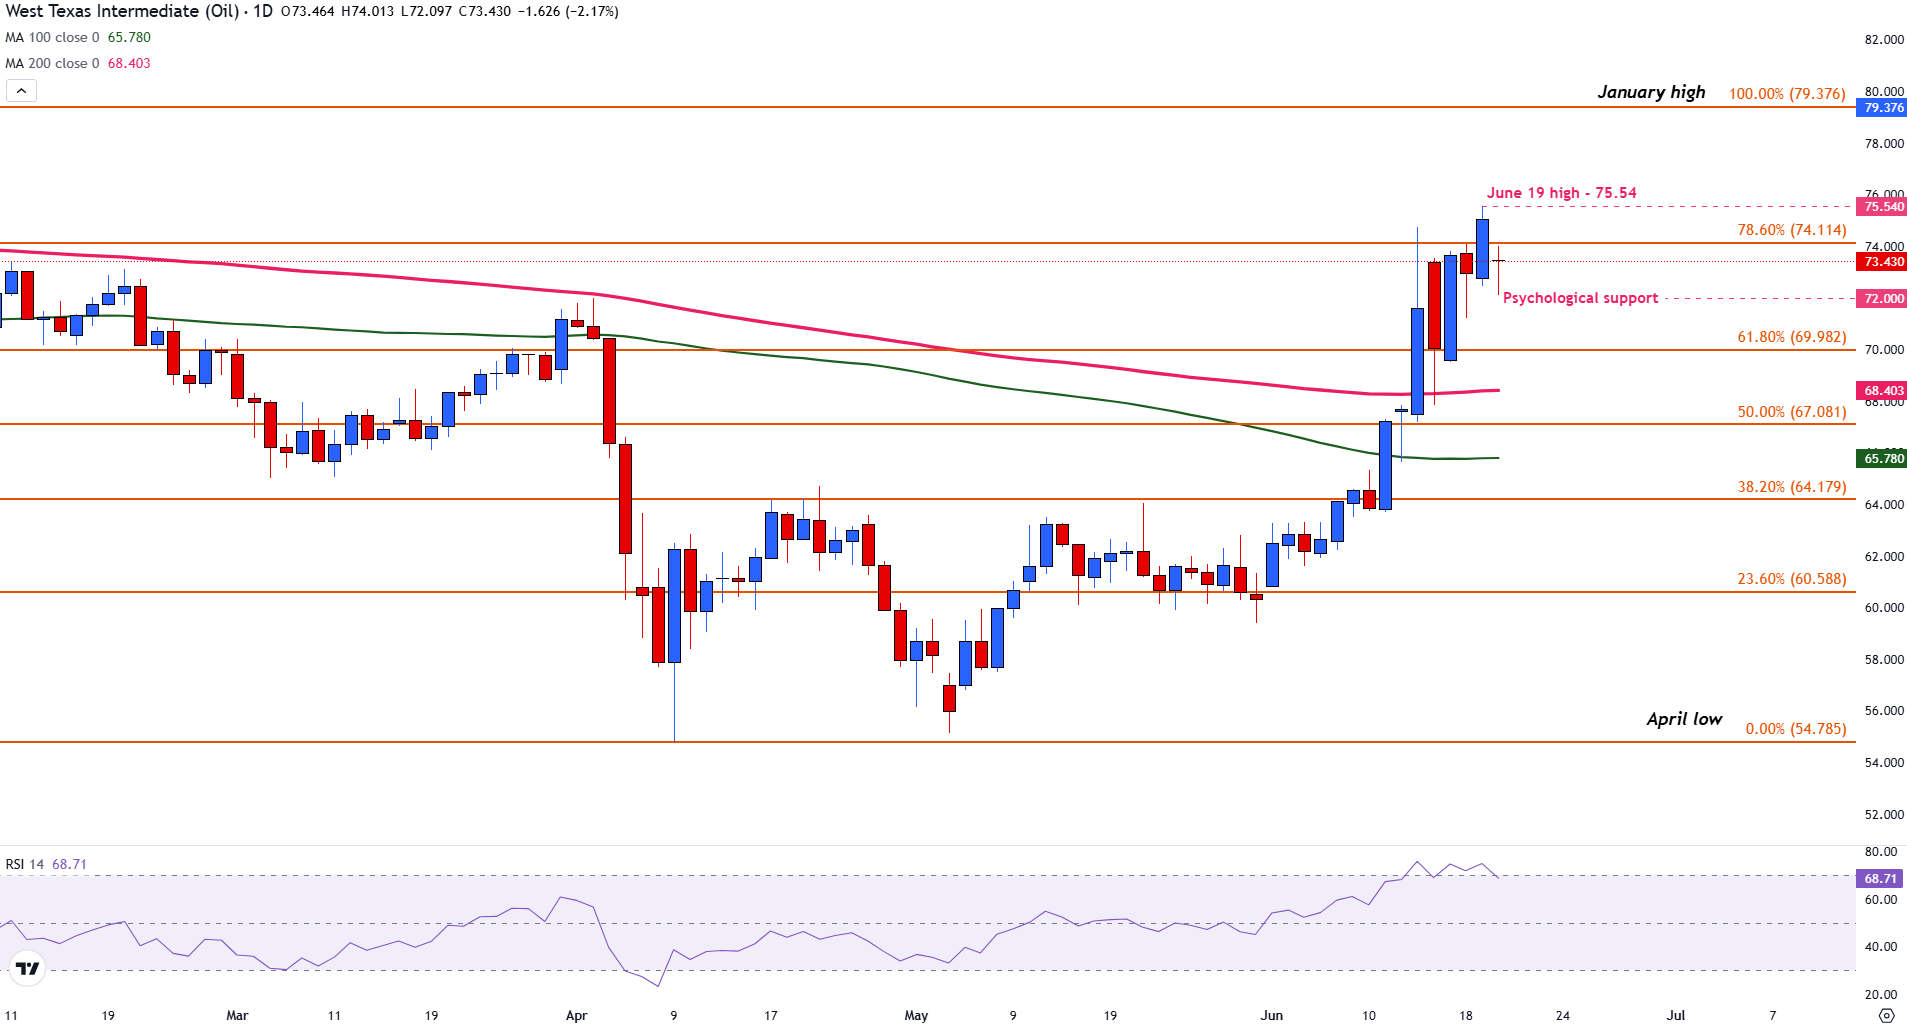
From a technical standpoint, WTI remains above key Simple Moving Averages (SMA), with the 100-day and 200-day SMAs offering solid support at $65.78 and $68.40, respectively.
Initial support is seen at the psychological $72.00 mark, followed by the 61.8% Fibonacci retracement of the January-April decline at $69.98. Resistance stands at the June high of $75.54, with a breakout above that exposing the January high near $79.37.
The Relative Strength Index (RSI) is hovering just above 69, suggesting slightly less overbought conditions that could prompt a short-term pullback.
WTI crude Oil daily chart
Overall, crude is consolidating recent gains as diplomatic progress and tight US stockpiles pull the market in opposing directions. Traders will remain alert to further developments from Geneva and regional headlines for cues on Oil’s next move.
WTI Oil FAQs
WTI Oil is a type of Crude Oil sold on international markets. The WTI stands for West Texas Intermediate, one of three major types including Brent and Dubai Crude. WTI is also referred to as “light” and “sweet” because of its relatively low gravity and sulfur content respectively. It is considered a high quality Oil that is easily refined. It is sourced in the United States and distributed via the Cushing hub, which is considered “The Pipeline Crossroads of the World”. It is a benchmark for the Oil market and WTI price is frequently quoted in the media.
Like all assets, supply and demand are the key drivers of WTI Oil price. As such, global growth can be a driver of increased demand and vice versa for weak global growth. Political instability, wars, and sanctions can disrupt supply and impact prices. The decisions of OPEC, a group of major Oil-producing countries, is another key driver of price. The value of the US Dollar influences the price of WTI Crude Oil, since Oil is predominantly traded in US Dollars, thus a weaker US Dollar can make Oil more affordable and vice versa.
The weekly Oil inventory reports published by the American Petroleum Institute (API) and the Energy Information Agency (EIA) impact the price of WTI Oil. Changes in inventories reflect fluctuating supply and demand. If the data shows a drop in inventories it can indicate increased demand, pushing up Oil price. Higher inventories can reflect increased supply, pushing down prices. API’s report is published every Tuesday and EIA’s the day after. Their results are usually similar, falling within 1% of each other 75% of the time. The EIA data is considered more reliable, since it is a government agency.
OPEC (Organization of the Petroleum Exporting Countries) is a group of 12 Oil-producing nations who collectively decide production quotas for member countries at twice-yearly meetings. Their decisions often impact WTI Oil prices. When OPEC decides to lower quotas, it can tighten supply, pushing up Oil prices. When OPEC increases production, it has the opposite effect. OPEC+ refers to an expanded group that includes ten extra non-OPEC members, the most notable of which is Russia.
Author

Tammy Da Costa, CFTe®
FXStreet
Tammy is an economist and market analyst with a deep passion for financial markets, particularly commodities and geopolitics.


