WTI declines after disappointing US data, Middle East tension easing
- The WTI barrel price declined by more than 2% to $80.70.
- The US reported soft labor market figures.
- Tensions in the Middle East are easing, favouring the price to decline.

At the end of the week, the West Texas Intermediate (WTI) barrel is seeing sharp losses, mainly due to worries on the US economy, the largest Oil consumer, after the release of weak labor and economic activity data. In addition, as the Middle East tensions ease, markets are confident that there won't be any supply or demand disruptions also contributing to the downward movements.
The US Bureau of Labor Statistics revealed disappointing numbers, as job additions for October from the US economy fell short of expectations at 150,000 vs the 180,000 expected and decelerated from its revised previous figure of 297,000. In addition, the Unemployment Rate rose to 3.9%, above the expected 3.8% while the Average Hourly Earnings increased by 0.2% MoM, lower than the projections and tallied a 4.1% YoY increase. In line with that, if the US continues to reveal that its economy is weakening and that the cumulative effects of the monetary policy are kicking in just now, Oil prices could face further downside as lower energy would be demanded from the largest consumer in the world.
On the positive side, as the Federal Reserve (Fed) approaches the end of its tightening cycle, it would be beneficial for the WTI price as higher rates tend to be negatively correlated with energy demand. In that sense, the market focus shifts to the next reports ahead of the next Fed meeting in December, including two additional inflation readings and a job report.
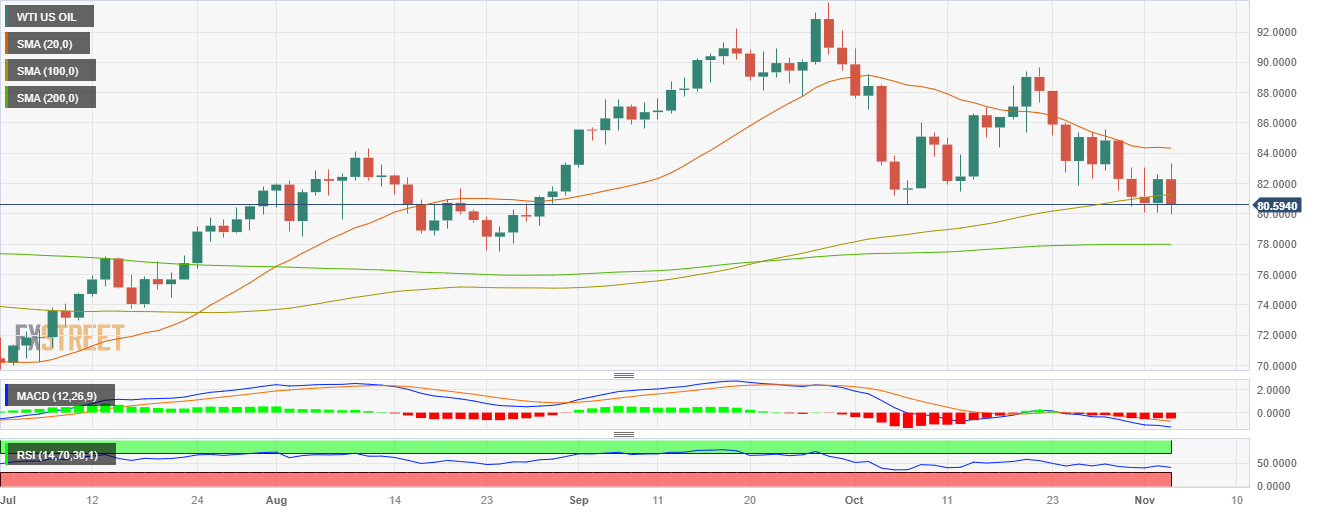
WTI Levels to watch
Upon evaluating the daily chart, a neutral to bearish outlook is seen for the WTI, with the balance starting to lean in favour of the bears, although they still have some work to do.The Relative Strength Index (RSI) has a negative slope below its midline, while the Moving Average Convergence (MACD) displays neutral red bars. In addition, the price has fallen below the 20 and 100-day Simple Moving Averages (SMA), which seem to be converging towards the $83.00 area to perform a bearish cross, which would likely trigger further downside for the WTI in the short term.
Support levels: $80.50, $80.30, $80.00.
Resistance levels: $81.60 (100-day SMA), $82.80, $83.50
WTI Daily Chart
Author

Patricio Martín
FXStreet
Patricio is an economist from Argentina passionate about global finance and understanding the daily movements of the markets.


