WTI Crude Oil trades above $61.00 with prices consolidating in a tight range
- WTI reclaims $61.00 to trade in a tight range between the 10-day and 20-day SMA.
- Oil prices remain under pressure amid an uncertain economic backdrop, but technical levels continue to contribute to the short-term price action.
- With investors closely monitoring the global growth outlook, key psychological levels provide additional barriers of support and resistance between the $60.00 - 64.00 price range.

Crude oil prices have rebounded on Friday, allowing prices to erase Thursday’s losses.
At the time of writing, WTI crude oil is trading 1.20% higher on the day, moving above the previous psychological resistance that has turned into support at 61.000.
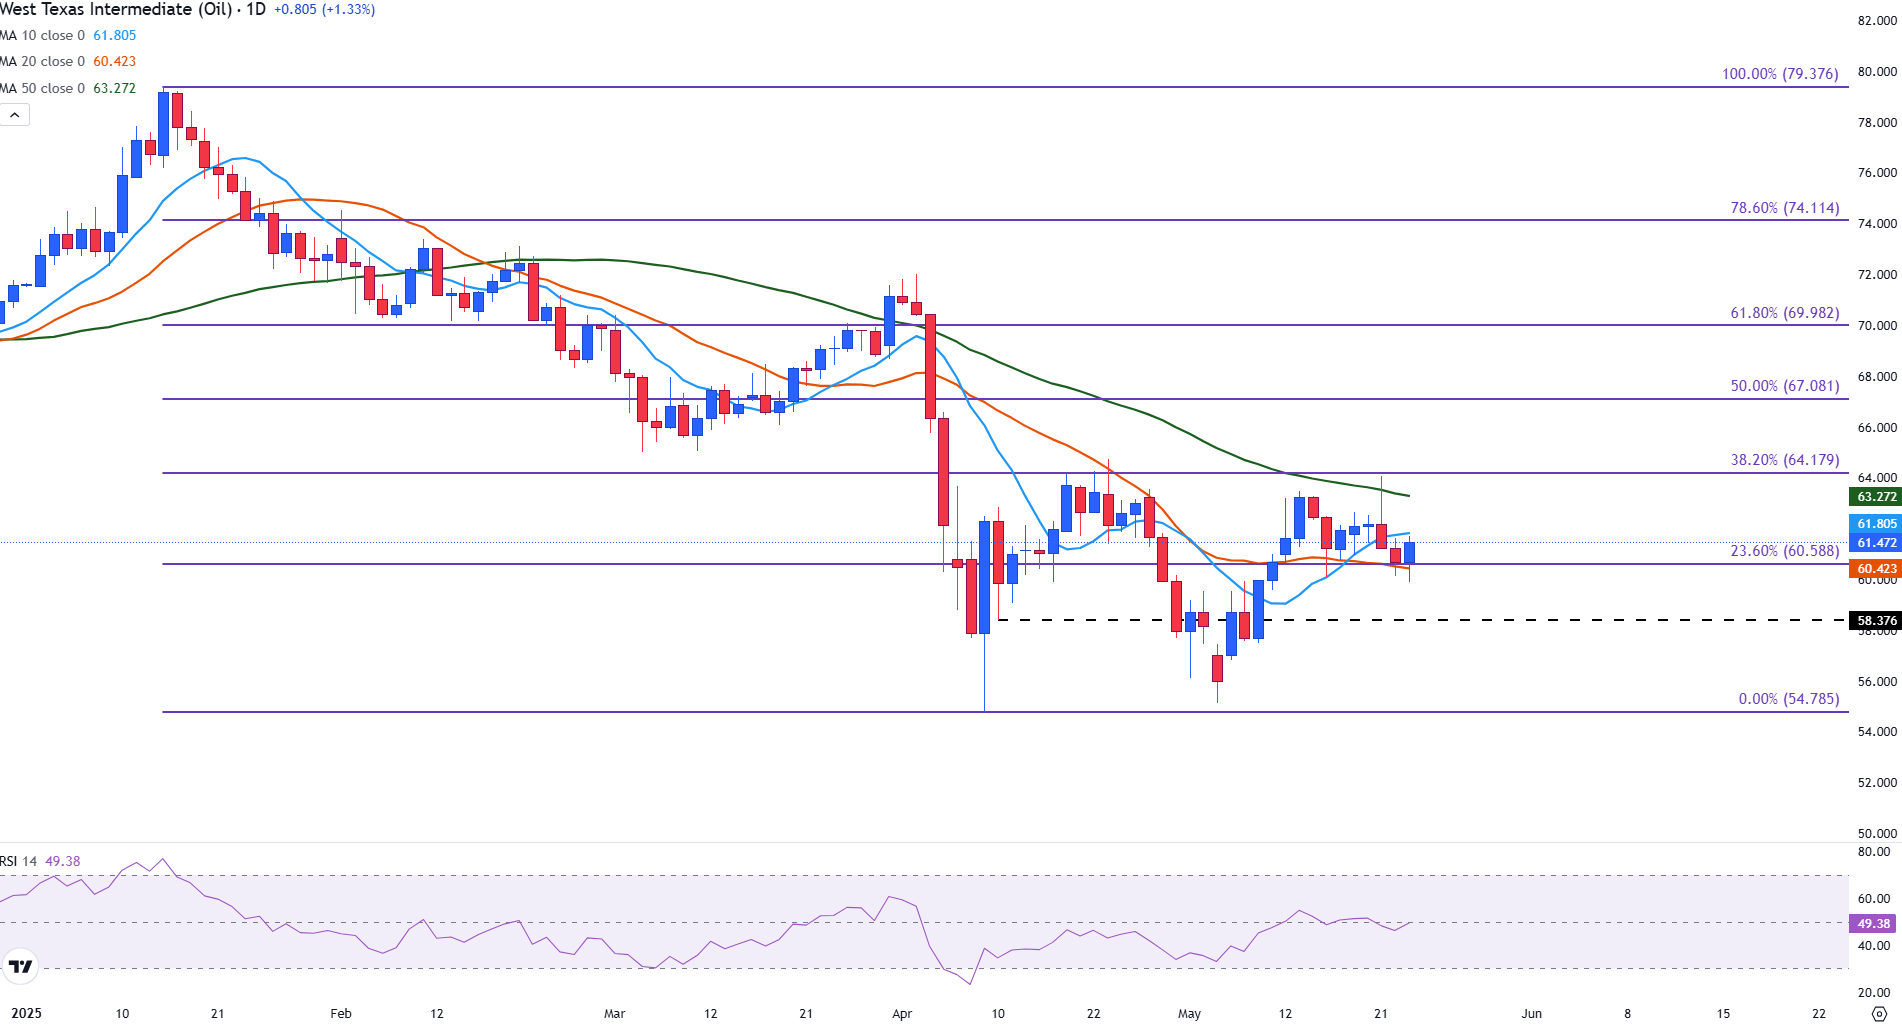
After experiencing two consecutive days of losses, the failure to drop below the 23.6% Fibonacci retracement level from the January-April year-to-date decline at 60.588 has provided some temporary relief for WTI oil bullish traders.
Currently, the 20-day Simple Moving Average (SMA) is positioned just below at 60.419, while the 10-day SMA offers immediate resistance near 61.805. Prices are currently fluctuating within a narrow range defined by these SMA levels, with the Relative Strength Index (RSI) reading at 49.00, indicating neutral momentum.
WTI Crude Oil daily chart
With various fundamental factors influencing oil prices, technical challenges exist on both the upside and downside.
For the uptrend to gain momentum, a strong bullish movement above the 10-day SMA and a breakout above the next psychological barrier at 62.000 are necessary. If that level is surpassed, the 50-day SMA at 63.270 could pave the way for a test of the 38.2% retracement level for the year-to-date decline, which stands at 64.179.
Conversely, if sellers manage to push prices below 60.588 and the 20-day SMA, the April 10 low at 58.376 and the year-to-date low of 54.785 may come into play.
WTI Oil FAQs
WTI Oil is a type of Crude Oil sold on international markets. The WTI stands for West Texas Intermediate, one of three major types including Brent and Dubai Crude. WTI is also referred to as “light” and “sweet” because of its relatively low gravity and sulfur content respectively. It is considered a high quality Oil that is easily refined. It is sourced in the United States and distributed via the Cushing hub, which is considered “The Pipeline Crossroads of the World”. It is a benchmark for the Oil market and WTI price is frequently quoted in the media.
Like all assets, supply and demand are the key drivers of WTI Oil price. As such, global growth can be a driver of increased demand and vice versa for weak global growth. Political instability, wars, and sanctions can disrupt supply and impact prices. The decisions of OPEC, a group of major Oil-producing countries, is another key driver of price. The value of the US Dollar influences the price of WTI Crude Oil, since Oil is predominantly traded in US Dollars, thus a weaker US Dollar can make Oil more affordable and vice versa.
The weekly Oil inventory reports published by the American Petroleum Institute (API) and the Energy Information Agency (EIA) impact the price of WTI Oil. Changes in inventories reflect fluctuating supply and demand. If the data shows a drop in inventories it can indicate increased demand, pushing up Oil price. Higher inventories can reflect increased supply, pushing down prices. API’s report is published every Tuesday and EIA’s the day after. Their results are usually similar, falling within 1% of each other 75% of the time. The EIA data is considered more reliable, since it is a government agency.
OPEC (Organization of the Petroleum Exporting Countries) is a group of 12 Oil-producing nations who collectively decide production quotas for member countries at twice-yearly meetings. Their decisions often impact WTI Oil prices. When OPEC decides to lower quotas, it can tighten supply, pushing up Oil prices. When OPEC increases production, it has the opposite effect. OPEC+ refers to an expanded group that includes ten extra non-OPEC members, the most notable of which is Russia.
Author

Tammy Da Costa, CFTe®
FXStreet
Tammy is an economist and market analyst with a deep passion for financial markets, particularly commodities and geopolitics.


