WTI Crude Oil slumps into $90 for Friday
- The selloff in WTI Crude Oil continues, US barrel prices fall $2 on Friday.
- Crude oil is setting on the low side to cap off Friday's trading after a scorching run in the early half of the week.
- Oil's bid may have been overextended as US production ramps up.

The West Texas Intermediary (WTI) crude oil charts are deflating after reaching a near-term peak near $94/bbl, but profit-taking and investors waking up from crude oil delirium. Friday's Oil prices fell nearly 3% to an intraday low of $89.50.
Despite Friday's pressure release, crude prices still remain well-elevated. WTI rose over 7% from the week's bottom near $87.75 before setting 13-month highs just shy of $94.00.
Oil has been on an absolute tear recently, with global markets fearing a constraint on total supply with production falling nearly 2 million bpd short of demand.
US oil reserves have dipped significantly in recent weeks, adding fuel to Oil's bullish fire, but recent reporting from the Energy Information Administration (EIA) notes that US crude oil production is easily pinging into multi-year highs as fossil fuels production ramps up to swallow up the demand gap left by Saudi Arabia and Russia's extended production cuts of a combined 1.3 million bpd through the end of the year.
Total US crude reserves have tumbled to barely 420 million barrels, and the key Cushing, Oklahoma reserve levels have plummeted to barely 20 million barrels.
Despite supply constraints and evaporating reserves, US oil production is poised to ramp up to record highs, and investors are rapidly adjusting their forward-looking expectations for the costs of crude.
WTI technical outlook
WTI crude barrel prices have tumbled back to the 200-hour Simple Moving Average (SMA) after reaching a peak at $94.00, and Friday's intraday upside whip sees near-term resistance priced in at the $92.00 price level.
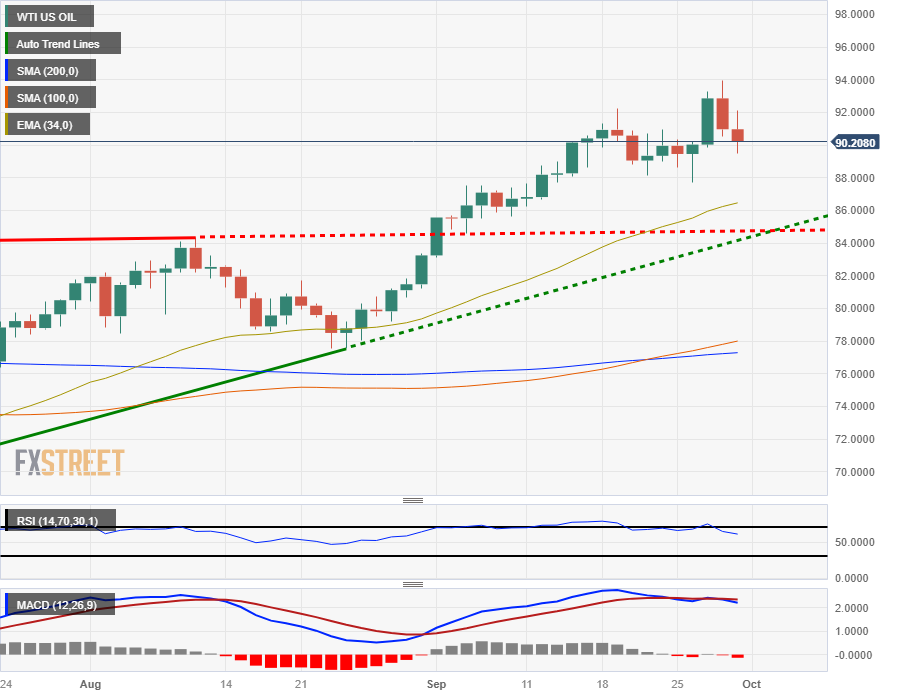
On daily candlesticks, prices remain significantly bullish, far above the 200-day SMA at $77.00 and the 34-day Exponential Moving Average (EMA) near $86.00.
Immediate technical support comes at the last minor swing low near $88.00, and the start of a bearish trend will need to contend with the rising trendline from June's late swing low into $67.00.
WTI daily chart
WTI technical levels
Author

Joshua Gibson
FXStreet
Joshua joins the FXStreet team as an Economics and Finance double major from Vancouver Island University with twelve years' experience as an independent trader focusing on technical analysis.