WTI crude oil rebounds above $61 as bulls defend $55 base, upside capped by Iran, OPEC+ supply risk
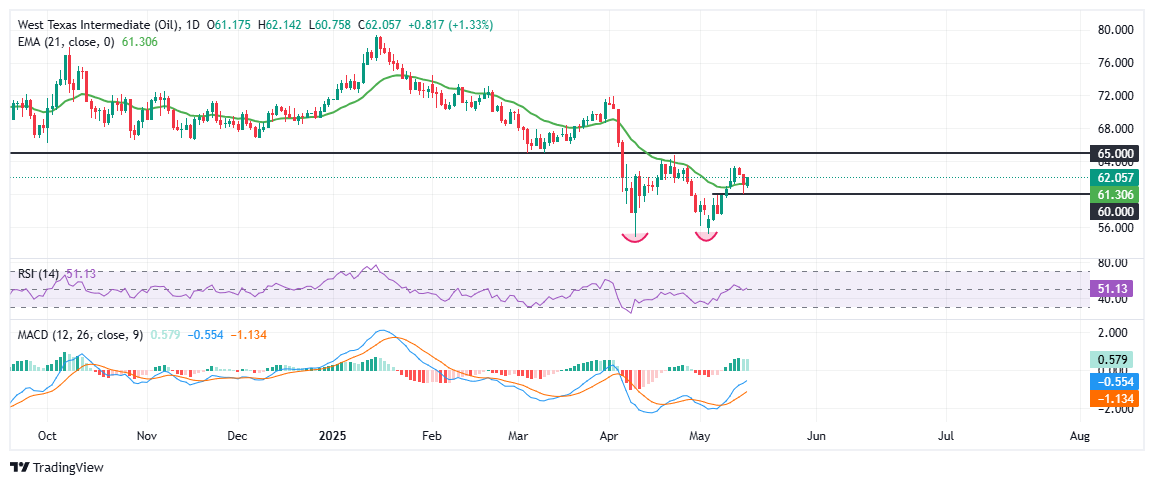
- WTI snaps a two-day losing streak, key resistance sits at $65.
- Price reclaims 21-day EMA, technical momentum improves as RSI turns neutral.
- Iran nuclear deal prospects and OPEC+ supply strategy weigh on broader bullish sentiment.

West Texas Intermediate (WTI) crude oil is trading around $62 on Friday ahead of the weekend, staging a modest rebound after snapping a two-day losing streak. The US Oil found renewed buying interest following a retest of the $55 support zone, where a potential double-bottom structure has formed on the daily chart. While the short-term technical picture has improved, macroeconomic and geopolitical headwinds, especially surrounding rising Organisation of the Petroleum Exporting Countries (OPEC+) output and the potential return of Iranian barrels, continue to weigh on sentiment.
OPEC+ supply strategy and Iran talks cloud the outlook
OPEC+’s recent move to raise production has introduced fresh downside risks to oil markets. Saudi Arabia and key allies are growing less willing to carry the burden of cuts alone, and the group has warned that all voluntary reductions—totaling 2.2 million barrels per day (bpd)—could be unwound by Q4 of 2025 if quota discipline doesn't improve.
Meanwhile, renewed hopes of a United States (US)–Iran nuclear deal are capping oil's rebound. Diplomats suggest progress has been made, and analysts estimate a deal could bring back as much as 800,000 bpd of Iranian supply. These developments have reintroduced a bearish overhang as the market attempts to stabilize.
Technical outlook: WTI holds above short-term key support, but $65 remains the line in the sand
Technically, WTI has managed to stay afloat above the $60 psychological level, while defending the $55 double-bottom base—a zone that marks the lowest levels since 2021. The daily chart shows the price reclaiming the 21-day Exponential Moving Average (EMA) at $61.29, a short-term bullish signal. The Relative Strength Index (RSI) has moved up to 50.70, while the Moving Average Convergence Divergence (MACD) histogram has turned positive, indicating a mild recovery in bullish momentum.
That said, upside remains limited near the $65 handle, which aligns with previous support-turned-resistance and the April breakdown zone. A daily close above $65 would be required to confirm a broader trend reversal. Failure to do so could keep WTI stuck in a $55–$65 consolidation range. Traders will closely watch for fresh headlines on Iran, OPEC+ policy shifts, and macro data to drive the next directional move.
Author

Vishal Chaturvedi
FXStreet
I am a macro-focused research analyst with over four years of experience covering forex and commodities market. I enjoy breaking down complex economic trends and turning them into clear, actionable insights that help traders stay ahead of the curve.


