- WTI bears are in control and eye a test of $72.00.
- However, the M-formation could see a correction in the forthcoming hours from major support.
Oil prices are weaker in mid-day trade on Wall Street after the United States reported inflation last month rose at an annualized 6% pace, matching expectations and down from 6.4% in January.
However, inflation is still way above the Federal Reserve's targets which imply prospects of a recession, especially amid the banking sector concerns that continue to challenge growth and demand-dependent commodities such as oil.
West Texas Intermediate crude oil is down by over 3% on the day now and printing fresh session lows in New York at the time of writing.
Looking to the charts, we can apply a multi-time frame analysis to determine prospects of a correction in the meanwhile but ultimately, a bearish bias prevails as follows:
WTI daily charts
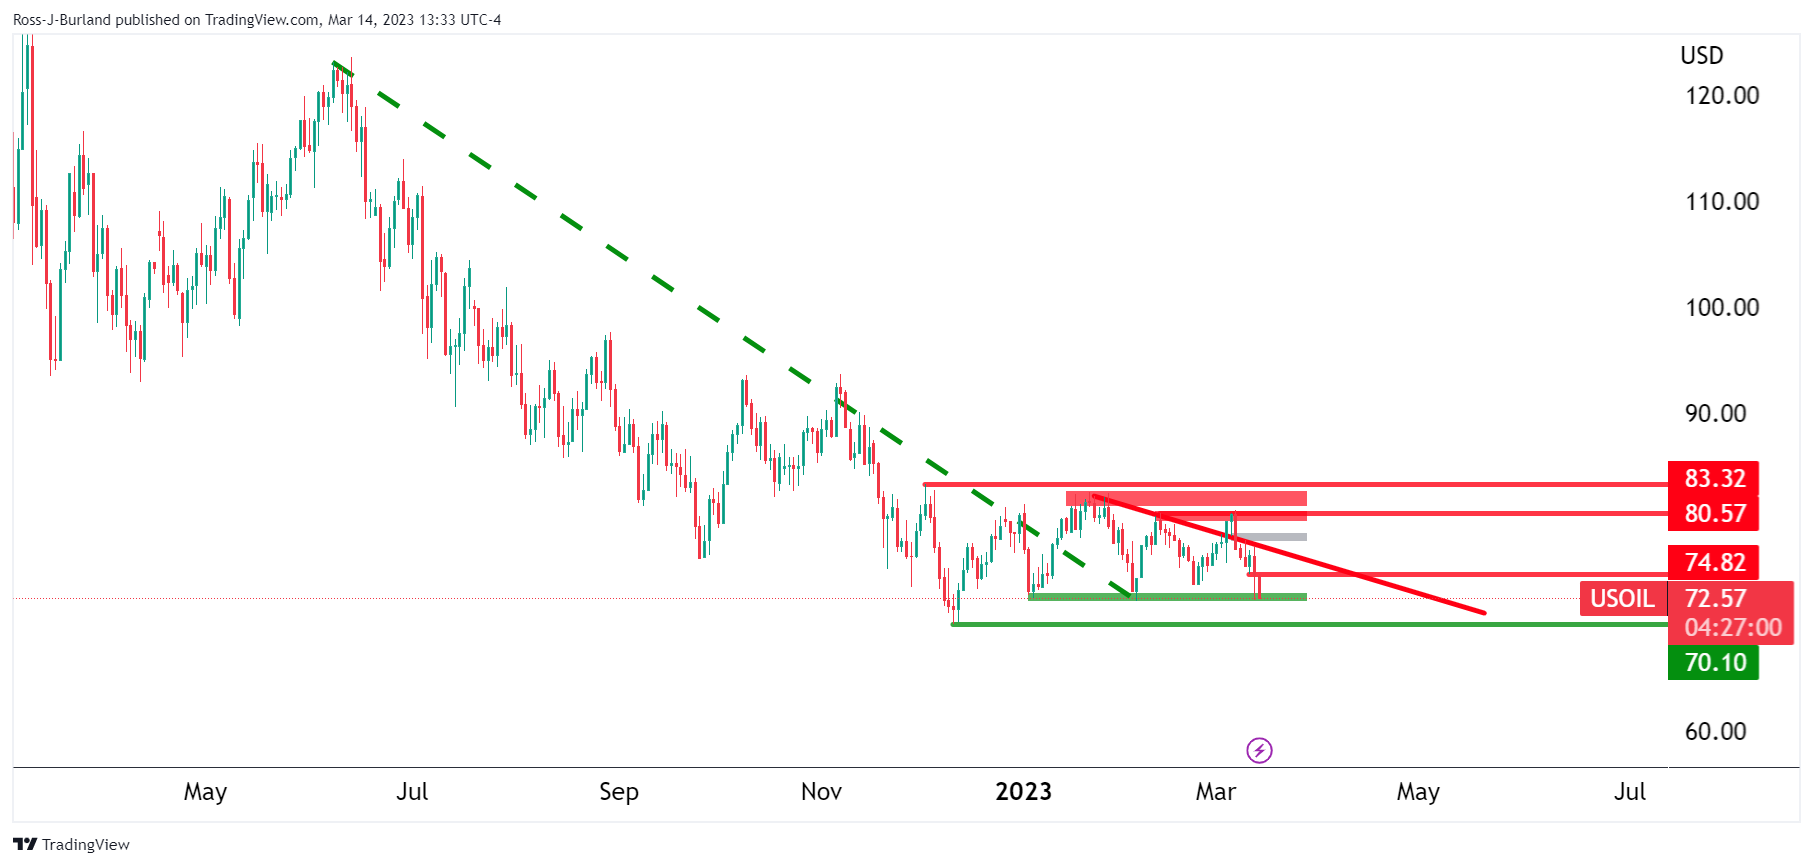
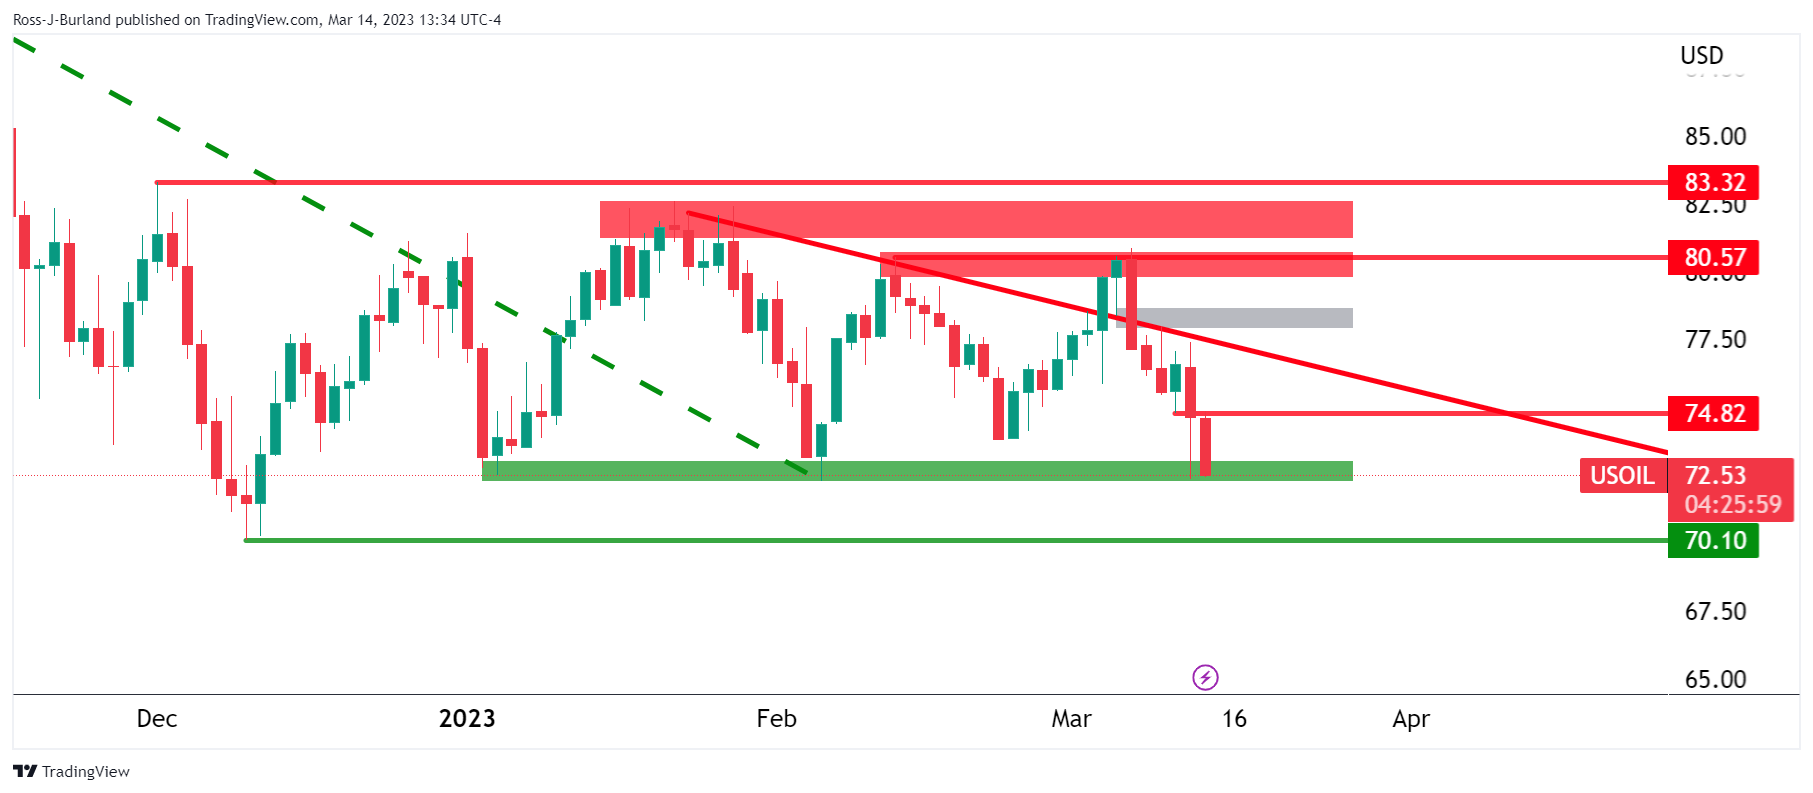
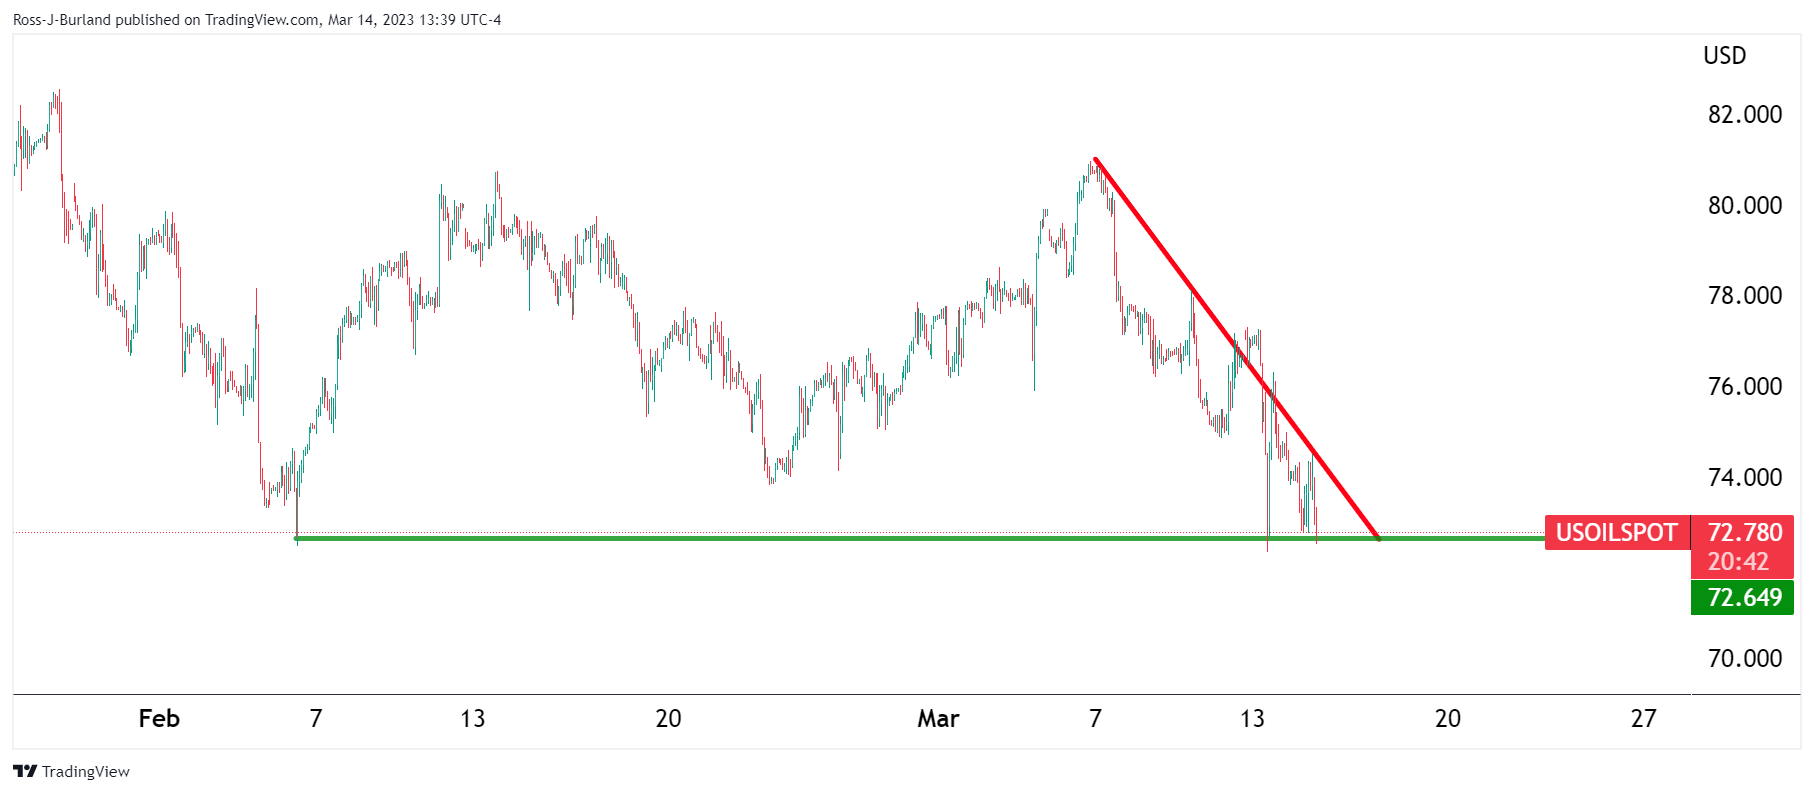
In a series of lower highs, the daily charts show the price moving sideways within a broad range of between $70.10 and $83.32. There is a price imbalance, greyed area, above $77.50, but the momentum is with the bears while below $74.80, and liquidity below $70.10 is calling. However, while being on the backside of the bearish trend, (broken bear trendline), this could be a phase of accumulation and a clear out of stale stops below $70.10 could result in a surge of demand further down the line. nonetheless, the bears are in control for the time being
WTI weekly charts
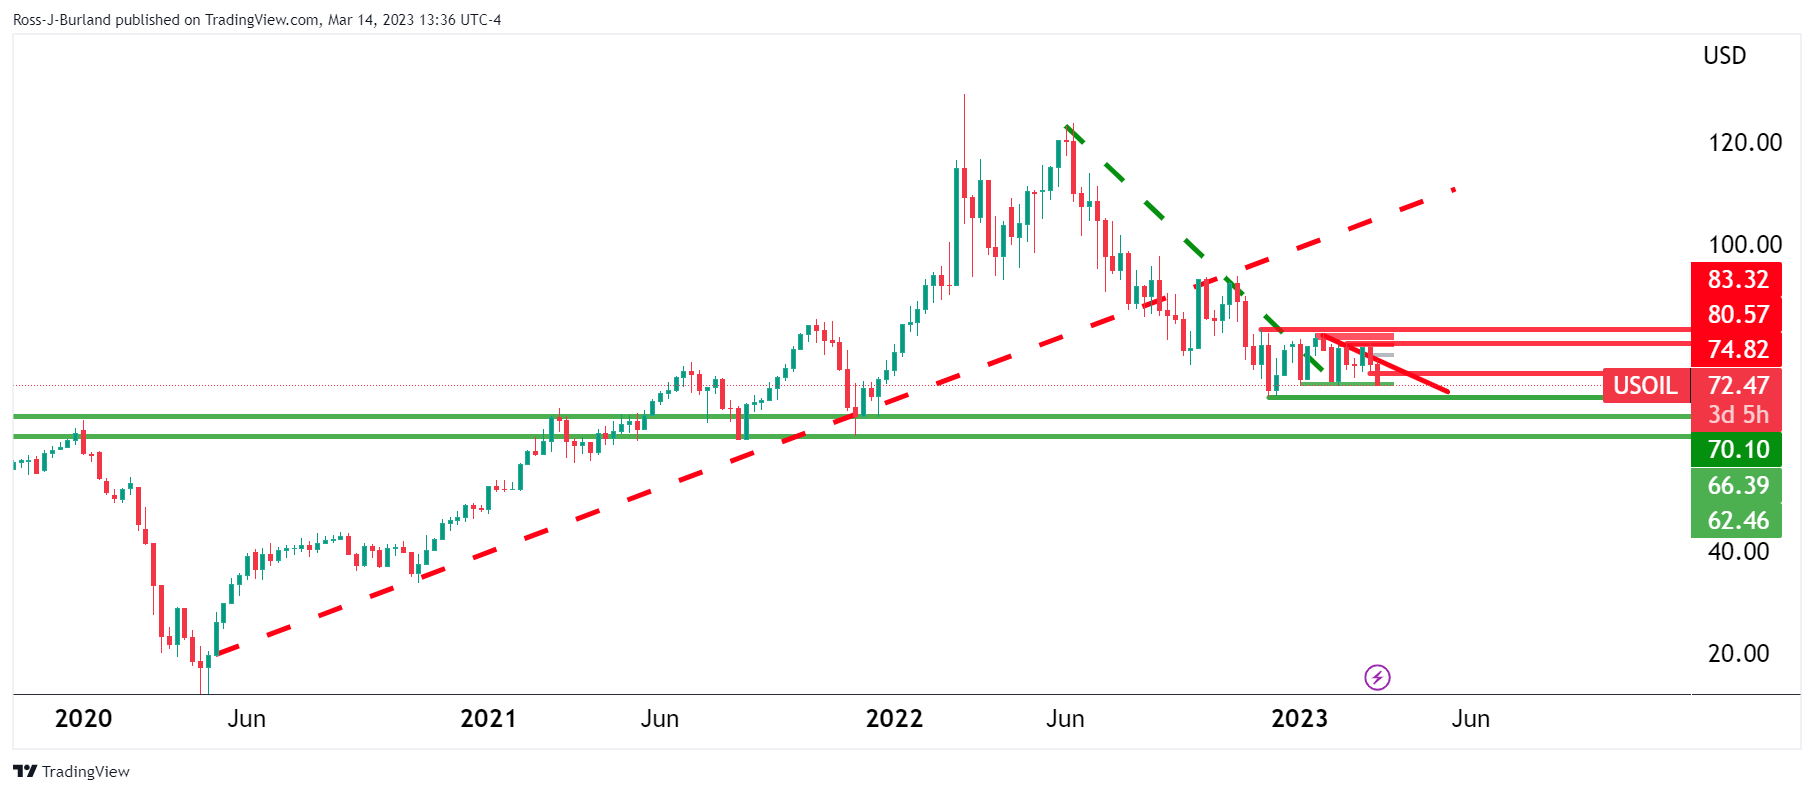
The weekly charts show that the price broke the bullish trend and is now backside and moving sideways but still biased lower while on the front side of the micro bear trendline below $74.82 as illustrated above.
However, the M-formation could hamstring the bears between $70.25 and the neckline near a 50% mean reversion of $76.70.
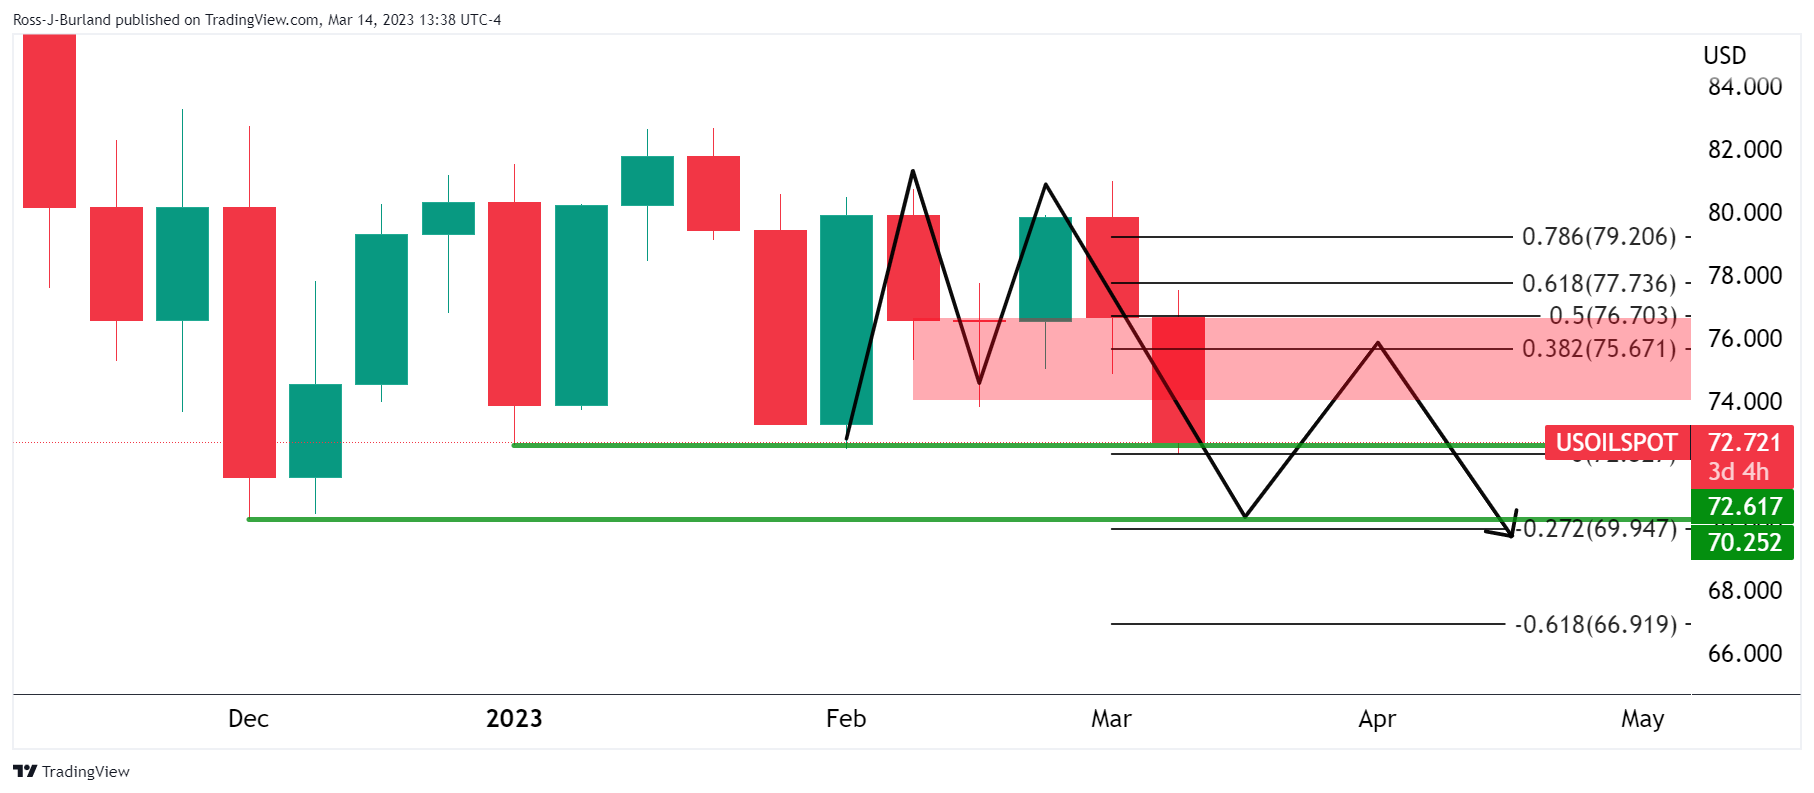
WTI H1 charts
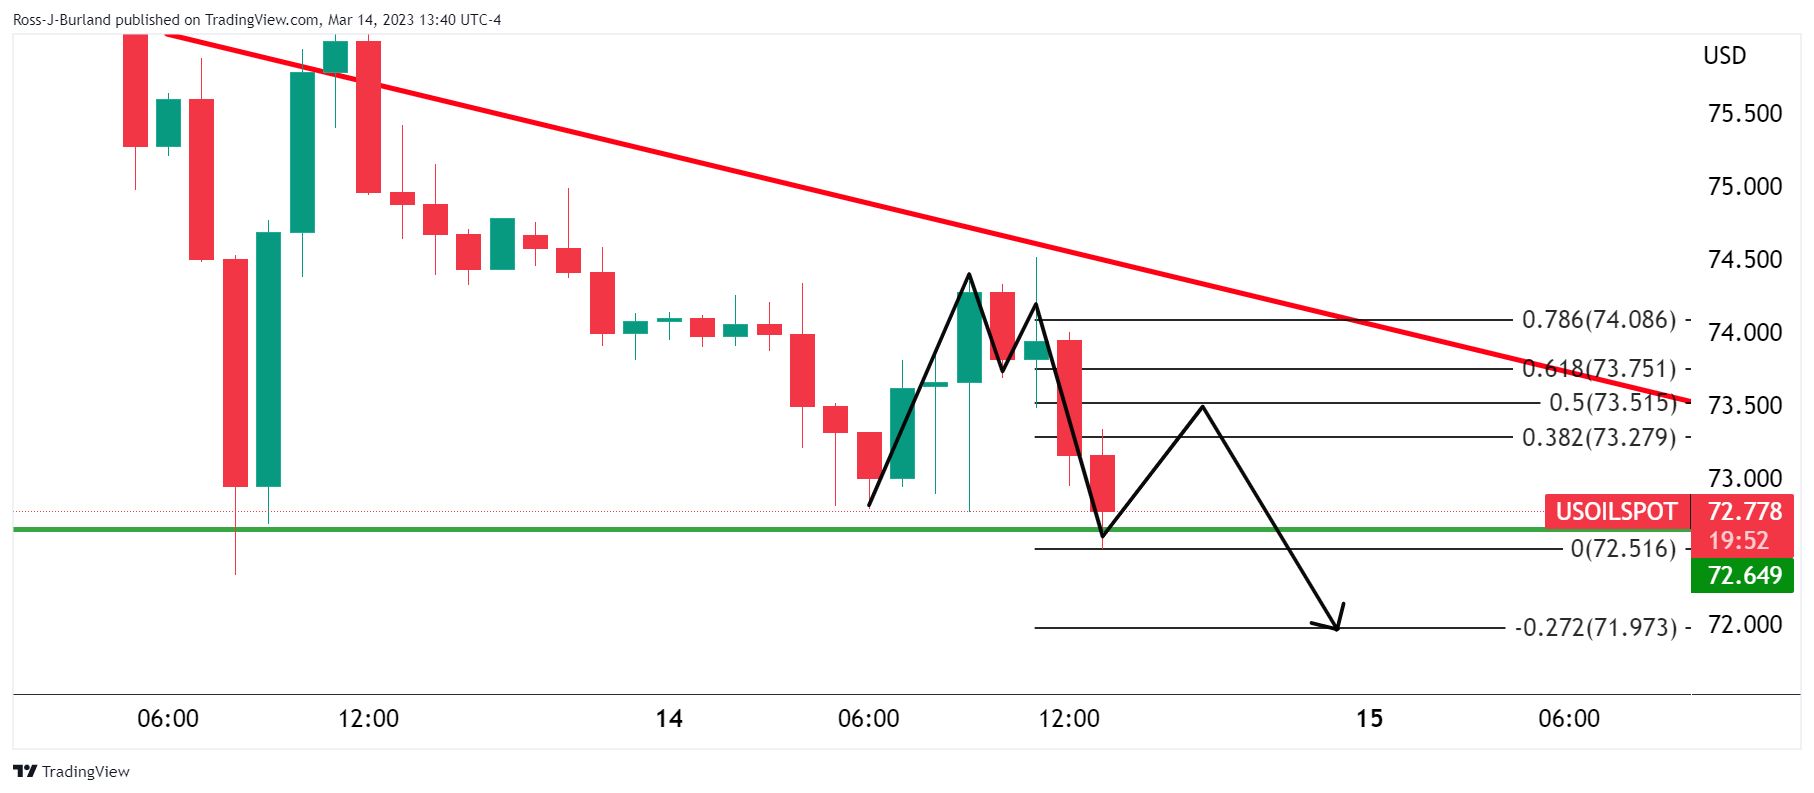
Moving down to the hourly chart, we see that the price is indeed on the front side of the bear trendline but meeting support. The M-formation, zooming in, is a reversion pattern that could see a correction in the forthcoming hours from support before a downside continuation to test $72 the figure.
Information on these pages contains forward-looking statements that involve risks and uncertainties. Markets and instruments profiled on this page are for informational purposes only and should not in any way come across as a recommendation to buy or sell in these assets. You should do your own thorough research before making any investment decisions. FXStreet does not in any way guarantee that this information is free from mistakes, errors, or material misstatements. It also does not guarantee that this information is of a timely nature. Investing in Open Markets involves a great deal of risk, including the loss of all or a portion of your investment, as well as emotional distress. All risks, losses and costs associated with investing, including total loss of principal, are your responsibility. The views and opinions expressed in this article are those of the authors and do not necessarily reflect the official policy or position of FXStreet nor its advertisers. The author will not be held responsible for information that is found at the end of links posted on this page.
If not otherwise explicitly mentioned in the body of the article, at the time of writing, the author has no position in any stock mentioned in this article and no business relationship with any company mentioned. The author has not received compensation for writing this article, other than from FXStreet.
FXStreet and the author do not provide personalized recommendations. The author makes no representations as to the accuracy, completeness, or suitability of this information. FXStreet and the author will not be liable for any errors, omissions or any losses, injuries or damages arising from this information and its display or use. Errors and omissions excepted.
The author and FXStreet are not registered investment advisors and nothing in this article is intended to be investment advice.
Recommended content
Editors’ Picks
AUD/USD tumbles toward 0.6350 as Middle East war fears mount
AUD/USD has come under intense selling pressure and slides toward 0.6350, as risk-aversion intensifies following the news that Israel retaliated with missile strikes on a site in Iran. Fears of the Israel-Iran strife translating into a wider regional conflict are weighing on the higher-yielding Aussie Dollar.
EUR/USD extends its downside below 1.0650 on hawkish Fed remarks
The EUR/USD extends its downside around 1.0640 after retreating from weekly peaks of 1.0690 on Friday during the early Asian session. The hawkish comments from Federal Reserve officials provide some support to the US Dollar.
Gold price edges higher on risk-off mood hawkish Fed signals
Gold prices advanced late in the North American session on Thursday, underpinned by heightened geopolitical risks involving Iran and Israel. Federal Reserve officials delivered hawkish messages, triggering a jump in US Treasury yields, which boosted the Greenback.
Dogwifhat price pumps 5% ahead of possible Coinbase effect
Dogwifhat price recorded an uptick on Thursday, going as far as to outperform its peers in the meme coins space. Second only to Bonk Inu, WIF token’s show of strength was not just influenced by Bitcoin price reclaiming above $63,000.
Israel vs. Iran: Fear of escalation grips risk markets
Recent reports of an Israeli aerial bombardment targeting a key nuclear facility in central Isfahan have sparked a significant shift out of risk assets and into safe-haven investments.