WTI bulls capitulated, bearish continuation wedge starting to play out (long term play) - $52.00 price target
- WTI is currently trading at $61.36bbls having travelled lower by 3.49% on the day so far from a high of $63.65 to a low of $60.97bbls.
- A spike in U.S. supplies and record. crude production has weighed in on prices which were technically overbought according to stochastics.
- Technically, this could be start of a strong bearish trend, initially targetting below the $52 handle.

The move from yesterday has extended on Thursday following the U.S. government report that had revealed a nearly 10 million-barrel rise in domestic crude supplies which was the largest weekly climb year to date. The data has been accompanied by weekly U.S. crude production moving up by 100,000 barrels to a record 12.3 million barrels per day.
Then, on the flipside, due to Saudi Arabia's disclamations over Trump's assertions that OPEC will harmonize in efforts aimed to squeeze out Iranian oil trade from the market, we are seeing backwardation in Brent prices as spot continues to rise and the diverging price action between WTI and Brent is indicative of the market's growing belief that while the Brent market will likely remain tight, the US shale patch will likely keep the domestic market well supplied in relative terms weighing on the price of WTI, especially if stockpiles, which are the highest since 2017, continue to grow.
Meanwhile, with consideration to the U.S. waivers on Iran oil sanctions which have expired today, we will have to wait and see what OPEC will do about production in June, for at this point, we know from a) Oman’s energy minister Mohammed bin Hamad al-Rumhy, who said on Wednesday it was OPEC’s goal to extend the production cuts and b) Saudi Arabia’s energy minister Khalid al-Falih reportedly told Russia’s RIA news agency earlier this week that the Saudis will also adhere to the production-cut agreement led by OPEC and possibly extend the agreement when it expires in June.
WTI levels
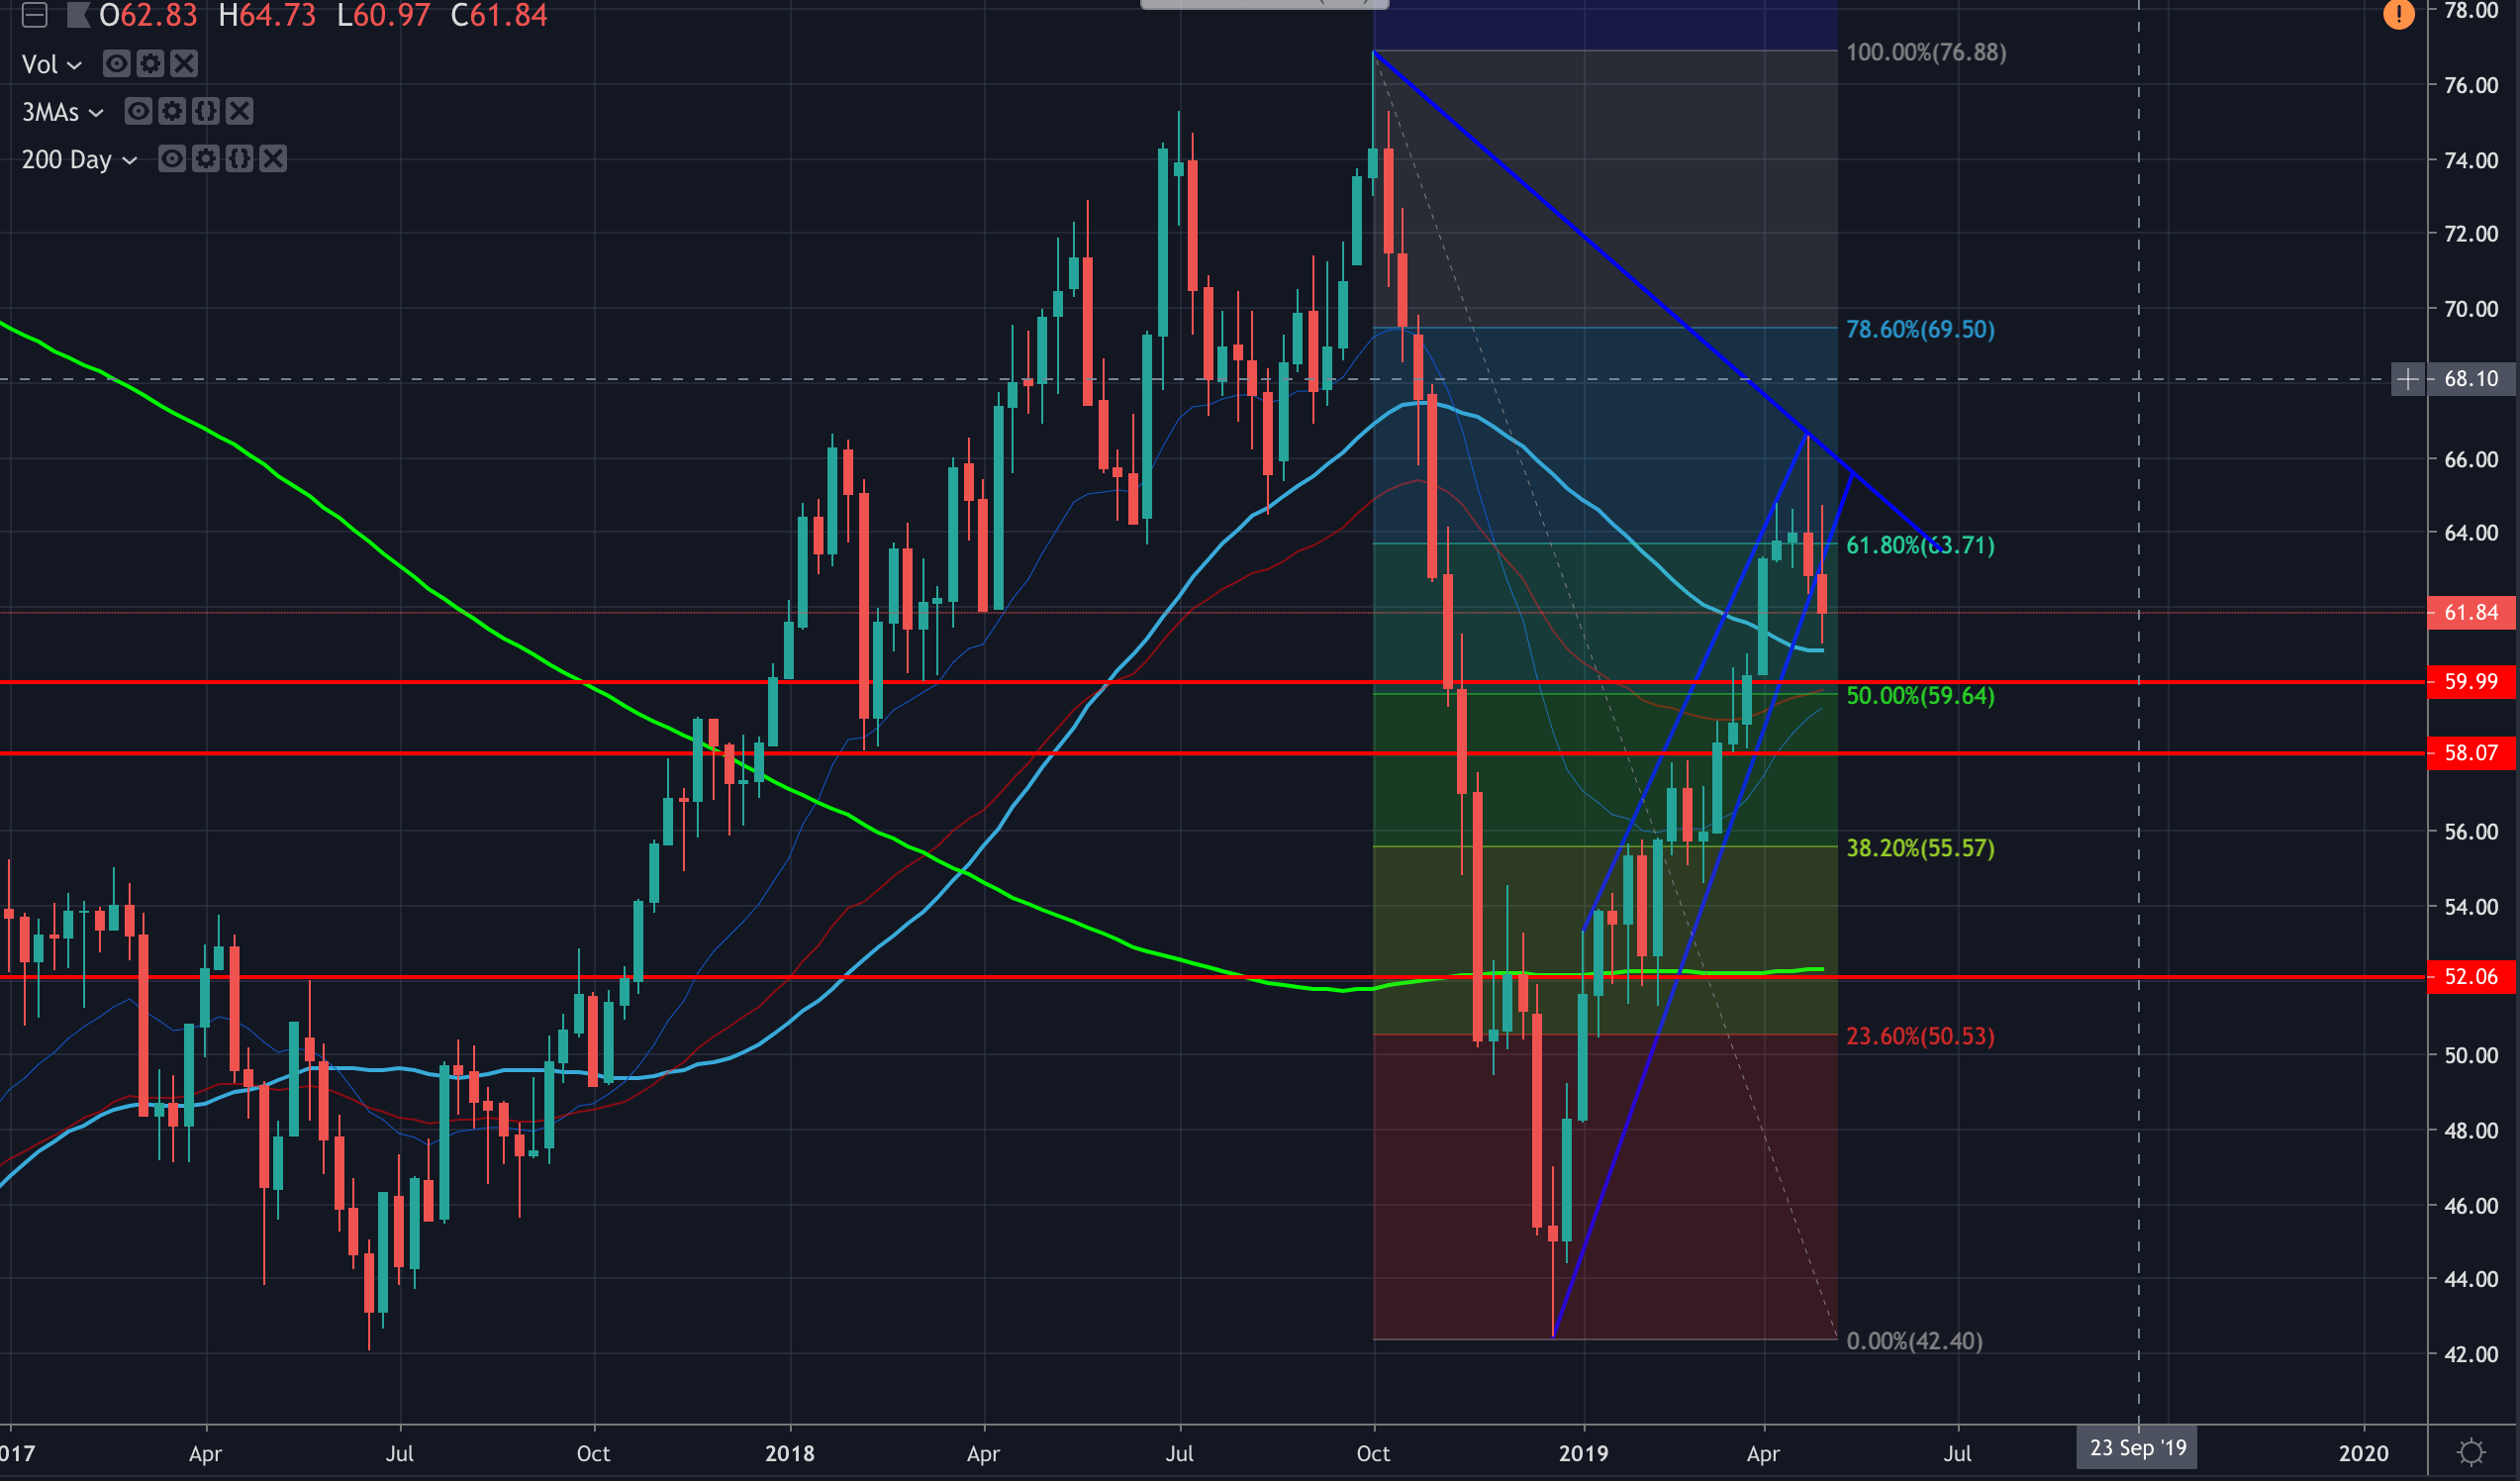
From a technical standpoint, the price has fallen away from the rising wedges' support. Stochastics still lean bearish on the longer time frames and bears are en route for a test of the 200-D SMA and 50-D SMA converging just below the low today. However, a mean reversion might be expected at this juncture and the 50% retracement of the move comes in at 62.31, in line with 26th April's low. A less ambitious retracement falls in at 61.80.
Bearish wedge continuation pattern breakout
However, the rising wedge is a bearish continuation pattern and wedges can be significant turning points. In this case, a break and continuation of the bear trend would target below the $42 handle and late Dec lows - (Wedge breakouts can see the price run in the breakout direction for long periods of time). The price could drop by at least the height of the wedge (measured at the base where the two trendlines start) which is around $10.80 for a target of $52.00 (at weekly 200 MA/ 50 pips above Feb lows).
Author

Ross J Burland
FXStreet
Ross J Burland, born in England, UK, is a sportsman at heart. He played Rugby and Judo for his county, Kent and the South East of England Rugby team.