WTI bears are in town below a critical dynamic counter trendline
- WTI bears are taking charge in a counter-trend and to below dynamic support.
- Covid spread fears and lockdowns are weighing on the energy complex.

The price of oil is down on Wednesday in the same fashion that we have seen over the past four days as the coronavirus remains a concern for the outlook for the energy complex amidst a strong US dollar.
WTI crude is down by some 1.6% and fell from a high of $67.47 to a low of $65.29.
We have seen several days of weakness due to the rise in infections caused by the Delta variant of the coronavirus both in the United States and worldwide.
Several countries have re-introduced travel restrictions and air traffic has softened in recent weeks.
On of the largest oil importers, Japan, has announced that the coronavirus state of emergency will continue through September 12 rather than finishing at the end of this month.
The state of emergency for Tokyo, Osaka, Okinawa, and three other regions that began in July will be extended and expanded.
Commerzbank analyst Carsten Fritsch said earlier on the matter that "this is likely to impact fuel demand in Japan, which is the world's fourth-largest oil consumer and importer. It will therefore take longer no doubt for last year's slump in demand to recover."
Meanwhile, helping to stall the decline in prices, the market was helped by a bigger-than-expected drawdown in US crude inventories.
Investors fell 3.2 million barrels last week to 435.5 million barrels, their lowest since January 2020 and more than anticipated.
The rise follows on a 3.8% drop in prices over the past four losing sessions, which came on worries that the wildfire spread of Covid-19 in the United States and Southeast Asia is lowering demand.
Gasoline stocks, however, rose modestly, which kept the market from moving up given ongoing worries about coronavirus.
The International Energy Agency last week said it expects oil demand to fall by more than half a million barrels per day in the second half of this year.
As for the US dollar, it continues to outperform for its safe-haven status and the expectation of a taper announcement in the coming weeks.
The U.S. dollar index DXY was up 0.11%, hitting its highest level since April at 93.264 and stable on the low of 93.00.
Crude prices often move inversely to the dollar because the commodity is priced in dollars; when the US currency falls, it makes oil less expensive for foreign buyers.
WTI technical analysis
Broadly speaking, the price is in a bullish environment while trading above the 200-day smoothed simple moving average.
However, it has broken dynamic trendline support and is now trading below the 50-day SSMA.
The downside momentum is strong with daily RSI below 50 following a series of the strongly bearish daily engulfing and outsized candles and lower highs.
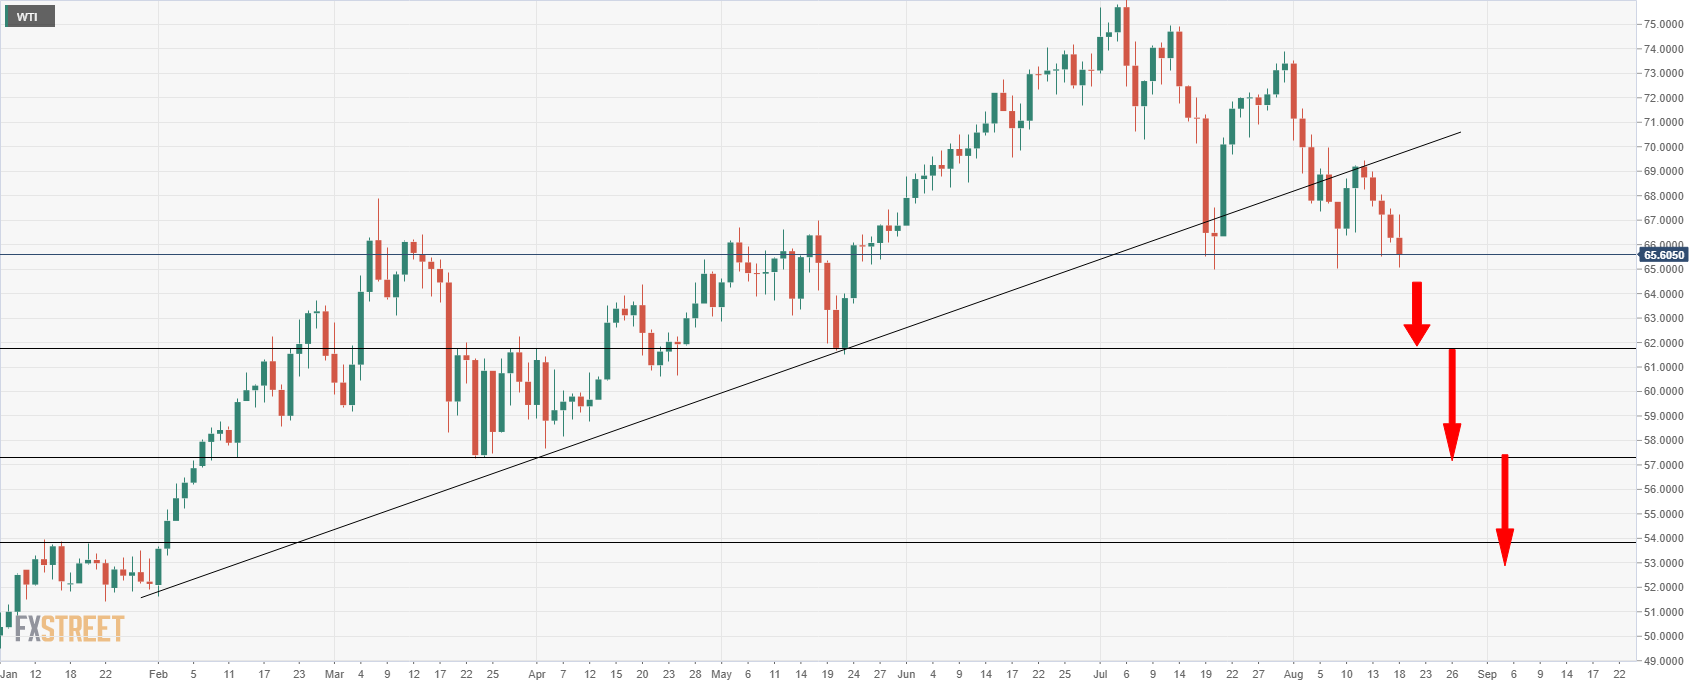
63.60 and 61.60 are the downside structural targets while the price is trading below the dynamic counter trendline.
Author

Ross J Burland
FXStreet
Ross J Burland, born in England, UK, is a sportsman at heart. He played Rugby and Judo for his county, Kent and the South East of England Rugby team.