|

WMT Elliott Wave technical analysis [Video]

WMT Elliott Wave technical analysis

Function: Trend.

Mode: Impulsive.

Structure: Motive.

Position: Wave {v}.

Direction: Upside in wave {v}.

Details: Assumption remains that wave {iv} has bottomed. However, due to the prolonged corrective action, there’s also a possibility that wave (ii) is still unfolding within wave {iv} as a flat correction.

Chart

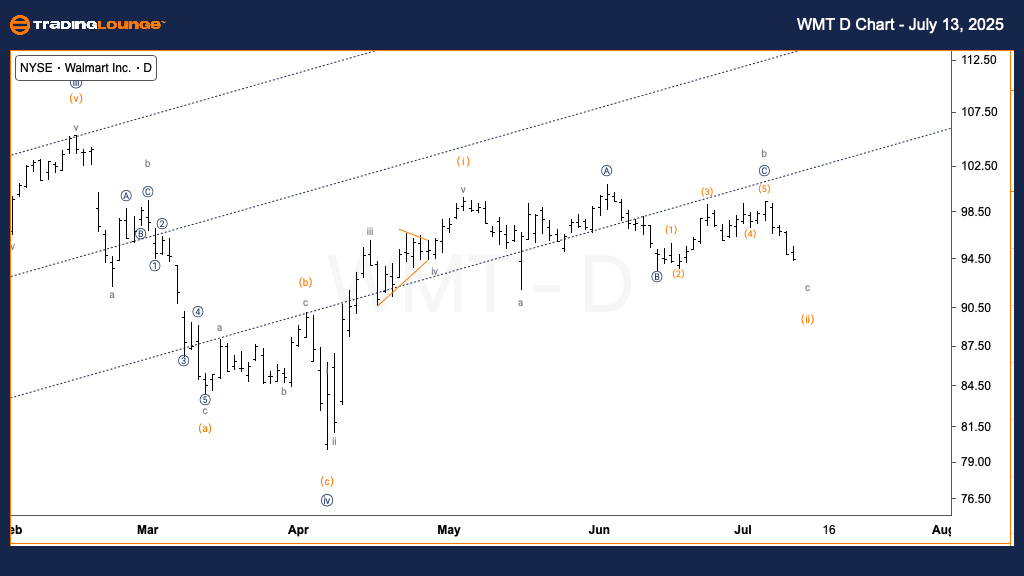
Walmart Inc. (WMT) is currently showing signs of a possible shift into wave {v} on the daily timeframe, contingent upon confirmation that wave {iv} has ended. Despite the bullish assumption, the extended correction introduces an alternative count, suggesting the market might still be developing wave {iv} as a flat within wave (ii).

The structure remains constructive, but bullish confirmation is required before confirming the continuation of the upward trend.

Function: Counter Trend.

Mode: Corrective.

Structure: Flat.

Position: Wave c of (ii).

Direction: Bottoming in wave cDetails: Expecting continued downside toward wave c completion. Equality of wave c versus wave a projects a target at $92.

Chart

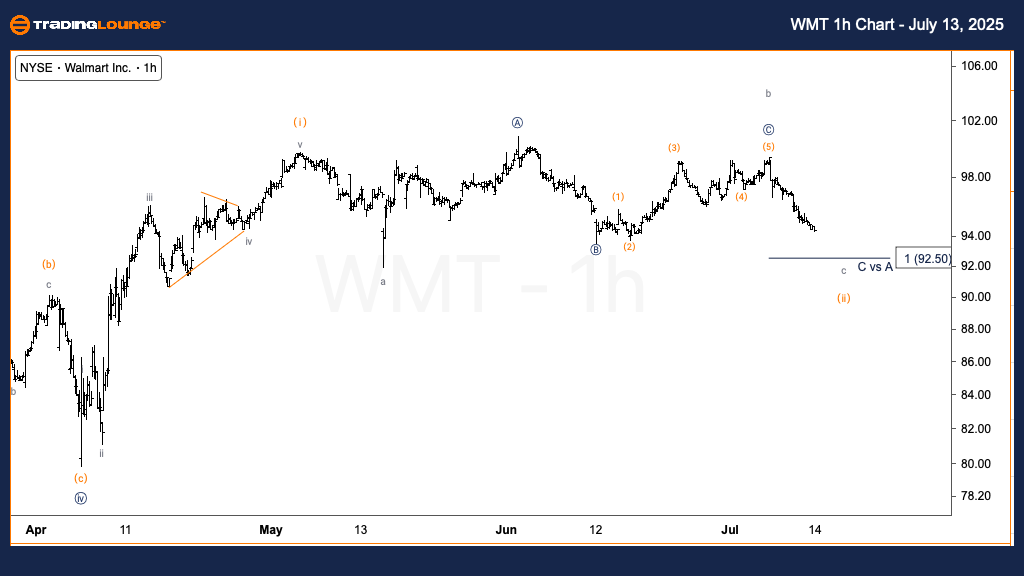
The 1-hour chart shows WMT likely finishing wave c of (ii) within a flat corrective pattern. The projected support level is around $92, aligning with wave c equaling wave a in length.

A bounce from $92 would indicate the correction is ending and wave {v} may soon begin. Until such movement occurs, traders should exercise caution, monitoring for signs of stabilization or reversal before entering new long positions.

WMT Elliott Wave technical analysis [Video]

Author

Peter Mathers

Peter Mathers

TradingLounge

Peter Mathers started actively trading in 1982. He began his career at Hoei and Shoin, a Japanese futures trading company.

More from Peter Mathers
Share:

Editor's Picks

EUR/USD holds firm near 1.1850 amid USD weakness

EUR/USD remains strongly bid around 1.1850 in European trading on Monday. The USD/JPY slide-led broad US Dollar weakness helps the pair build on Friday's recovery ahead of the Eurozone Sentix Investor Confidence data for February. 

GBP/USD holds medium-term bullish bias above 1.3600

The GBP/USD pair trades on a softer note around 1.3605 during the early European session on Monday. Growing expectation of the Bank of England’s interest-rate cut weighs on the Pound Sterling against the Greenback. 

Gold sticks to gains above $5,000 as China's buying and Fed rate-cut bets drive demand

Gold surges past the $5,000 psychological mark during the Asian session on Monday in reaction to the weekend data, showing that the People's Bank of China extended its buying spree for a 15th month in January. Moreover, dovish US Federal Reserve expectations and concerns about the central bank's independence drag the US Dollar lower for the second straight day, providing an additional boost to the non-yielding yellow metal. 

Bitcoin, Ethereum and Ripple consolidate after massive sell-off

Bitcoin, Ethereum, and Ripple prices consolidated on Monday after correcting by nearly 9%, 8%, and 10% in the previous week, respectively. BTC is hovering around $70,000, while ETH and XRP are facing rejection at key levels.

Japan's Takaichi secures historic victory in snap election

In Japan, Prime Minister Sanae Takaichi's coalition secured a supermajority in the lower house, winning 328 out of 465 seats following a rare winter snap election. This provides her with a strong mandate to advance her legislative agenda.

Bitcoin, Ethereum and Ripple consolidate after massive sell-off

Bitcoin, Ethereum, and Ripple prices consolidated on Monday after correcting by nearly 9%, 8%, and 10% in the previous week, respectively. BTC is hovering around $70,000, while ETH and XRP are facing rejection at key levels. Traders should be cautious: despite recent stabilization, upside recovery for these top three cryptocurrencies is capped as the broader trend remains bearish.