Why you should consider buying Alibaba stock after six days of selling
- BABA loses as much as 8% on Friday after Trump threatens renewed tariffs on China.
- President Trump grows alarmed at China's intentions of banning some exports of rare earth metals.
- The NASDAQ slumped over 2.2% on the news as stock bulls headed for the exits.
- Bulls might look for support near $158 or $123 as BABA chart shows possibility of hitting $215 early next year.

Alibaba (BABA) stock traded lower for its sixth straight session on Friday as shares of the Chinese mega-cap gave up more than 8% to momentarily trade below $159 for the first time since September 16.
US President Donald Trump sent the market off the cliff on Friday morning by threatening a renewed trade war with the globe's second-biggest economy. His voluminous social media post below comes in response to China whispering about possible export limits on rare earth metals used in a host of strategic industries.
President Donald Trump's Truth Social post / October 10, 2025
The key section is: "One of the Policies that we are calculating at this moment is a massive increase of Tariffs on Chinese products coming into the United States of America. There are many other countermeasures that are, likewise, under serious consideration."
News that the trade ceasefire that began over the summer between the US and China might be upended sent the NASDAQ down over 2.2%. Tech stocks, specifically, were most affected, and Alibaba is nothing if not a tech stock.
Alibaba stock news
The downfall in the share price comes after several months of win after win for Alibaba. On Thursday, Alibaba announced its partnership with the NBA's China unit. The tech giant will be building AI products to entice Chinese fans to follow the sport.
Alibaba Chairman Joe Tsai already owns the NBA's Brooklyn Nets, who are scheduled to play a preseason game against the Phoenix Suns in Macau this weekend.
Alibaba will be using its Qwen series of AI LLMs (large language models) in order to build NBA China's various product suite over the multiyear partnership.
The company's Qwen3-Max LLM had led to much of the share price rally over the past several months, and CEO Eddie Wu told a conference in late September that the company's $53 billion in AI infrastructure spend, announced in the spring, was already being revised higher.
At the start of October, Alibaba announced that its Amap product, which is similar to Google Maps, already had gained 360 million daily users.
Alibaba stock forecast
Alibaba stock was already heavily overbought on the Relative Strength Index (RSI) when it began selling off last Friday. The RSI on the previous Thursday, a day earlier, momentarily hit 79, which is well above the overbought threshold of 70.
This means that bulls should have been expecting a pullback. Between July 9 and October 2, BABA shares gained about 86%, largely on the strength of movement in its AI announcements, as well as the return of founder Jack Ma.
On Friday, BABA traded beneath the 23.6% Fibonacci retracement level at $171.68 and found support right after it reached the 38.2% Fibo at $158.69. It has remained trading above that level on Friday afternoon for several hours, always a good sign.
If BABA fails to break through the 38.2% Fibo again on Monday, this could be a perfect entry for bulls. However, since shares have been rising and falling within a wide price channel for a full year, bulls will wonder if they get an eventual pullback in the final months of this year into the 78.6% Fibo at $122.75. It would take some pretty extreme tariff rates from Donald Trump for BABA to find its way back there, but that price level does bisect the lower trendline that it bounced off of in January and July.
The 200-day Simple Moving Average (SMA) is also trending close to the 78.6% Fibo, giving it major significance.
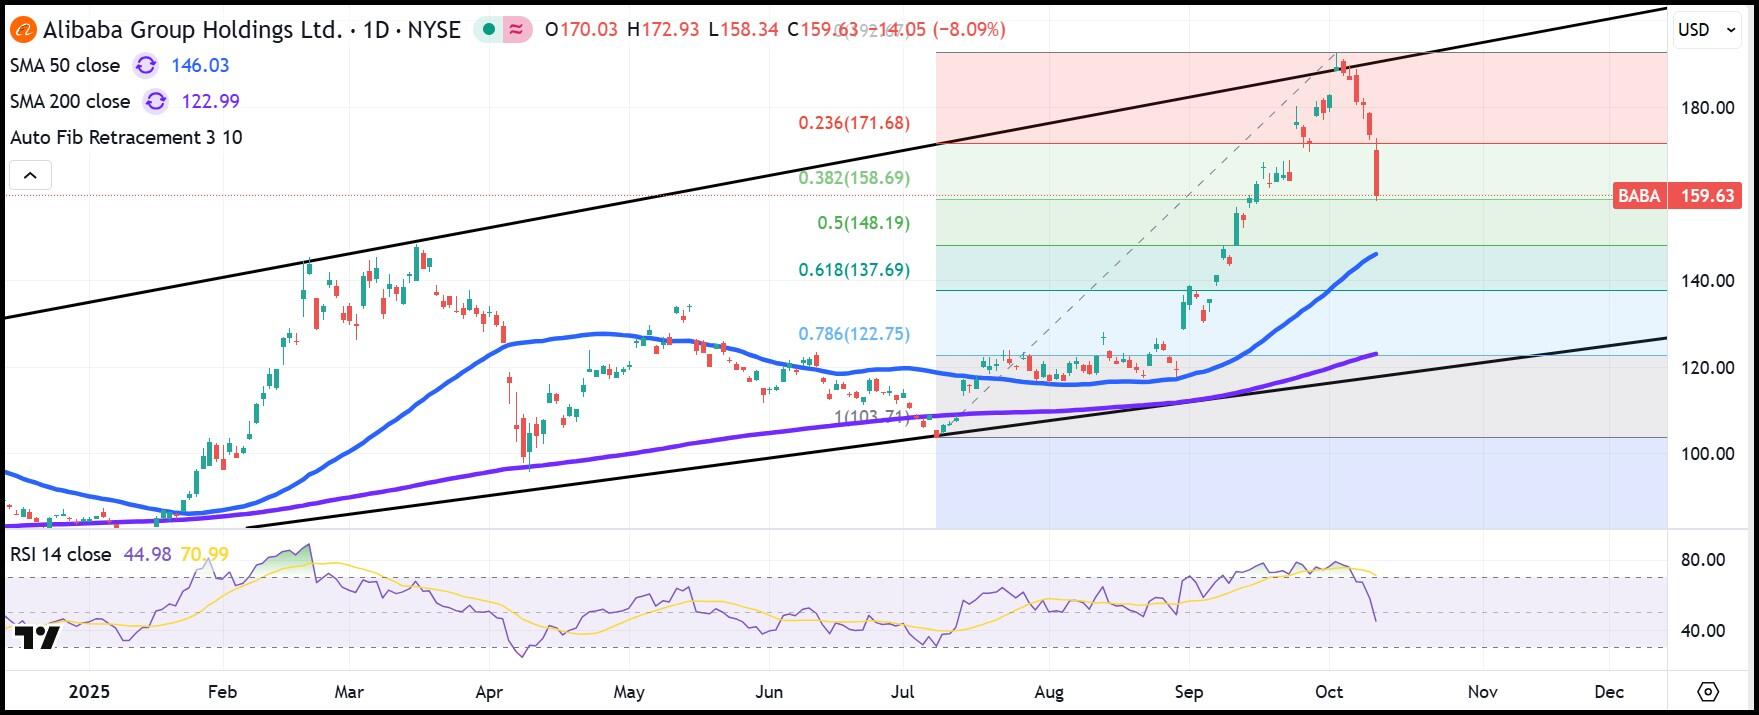
BABA daily stock chart
On the flipside, BABA's rally over the past year gives us a top trendline that bisects the 361.8% Fibo just above $215.00. However, it wouldn't seem likely to test that level until at least February 2026, four months from now, based on that intersection.
The weekly chart below offers a number of support scenarios in the region stretching from $123 to $134. But of course, the bulls love BABA, and new headlines or a trade deal between Trump and China could quickly end the pullback as soon as next week.
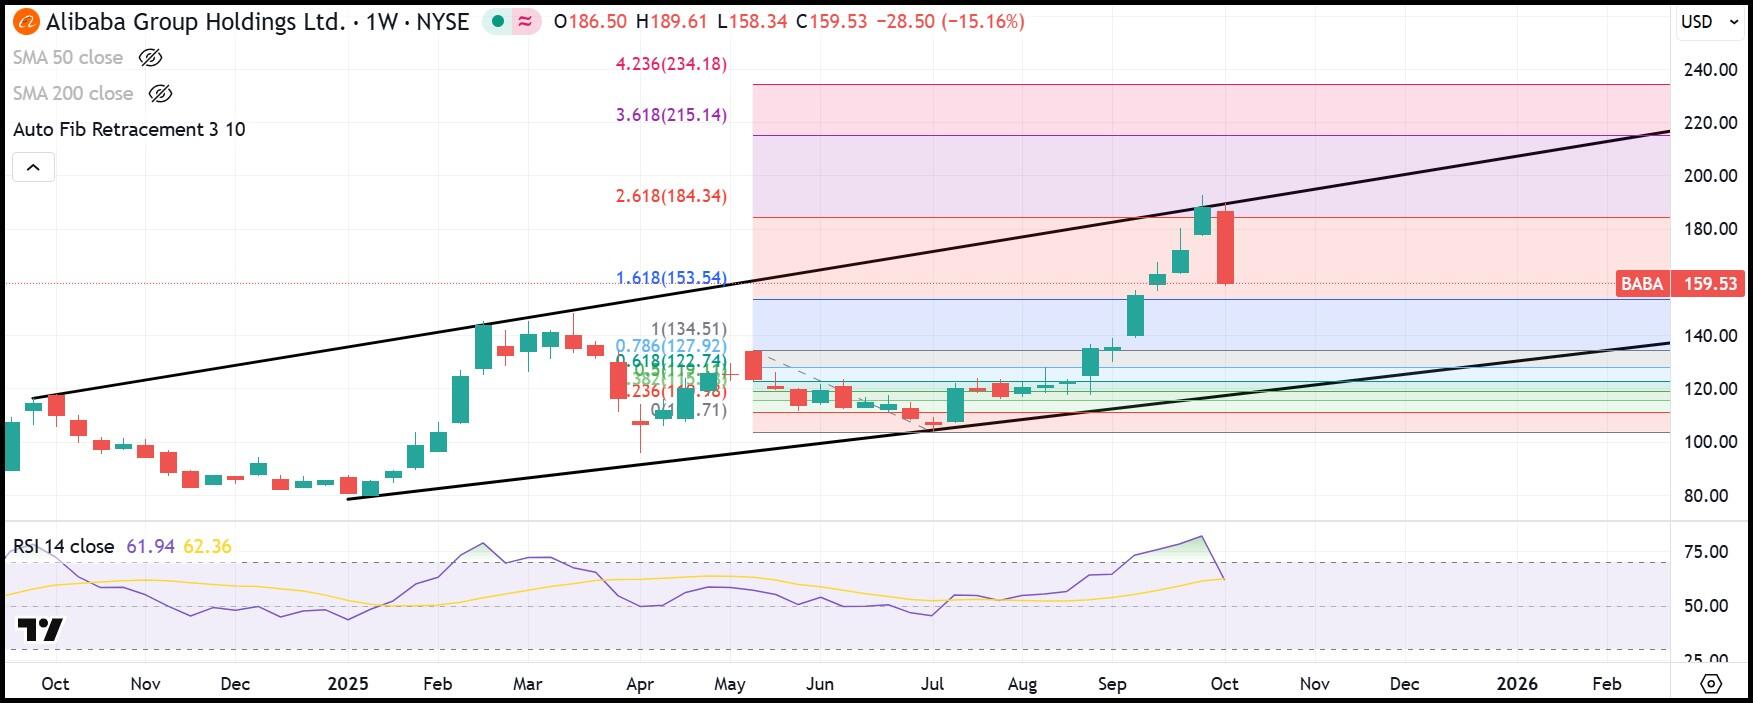
BABA weekly stock chart
Premium
You have reached your limit of 3 free articles for this month.
Start your subscription and get access to all our original articles.
Author

Clay Webster
FXStreet
Clay Webster grew up in the US outside Buffalo, New York and Lancaster, Pennsylvania. He began investing after college following the 2008 financial crisis.


