When are the US Initial Jobless Claims and how could they affect EUR/USD?

The US Initial Jobless Claims Overview
The United States (US) Initial Jobless Claims data for the week ending September 12 is due for release today at 12:30 GMT. The Department of Labour is expected to show that the number of individuals seeking jobless benefits for the first time dropped to 240K from the prior reading of 263K. This was the highest reading seen in four years.
The impact of the Initial Jobless Claims data would be significant on market expectations for the Federal Reserve’s (Fed) monetary policy outlook. Fed dovish expectations intensified last week after the release of the jobless claims data for the week ending September 5. A higher number of individuals filing for jobless benefits indicates a slowdown in job demand, a scenario that supports the need for monetary policy expansion by the Fed.
The US central bank reduced interest rates by 25 basis points (bps) to 4.00%-4.25% on Wednesday amid a slowdown in labor demand, even as inflationary pressures remain well above its 2% target.
How could they affect EUR/USD?
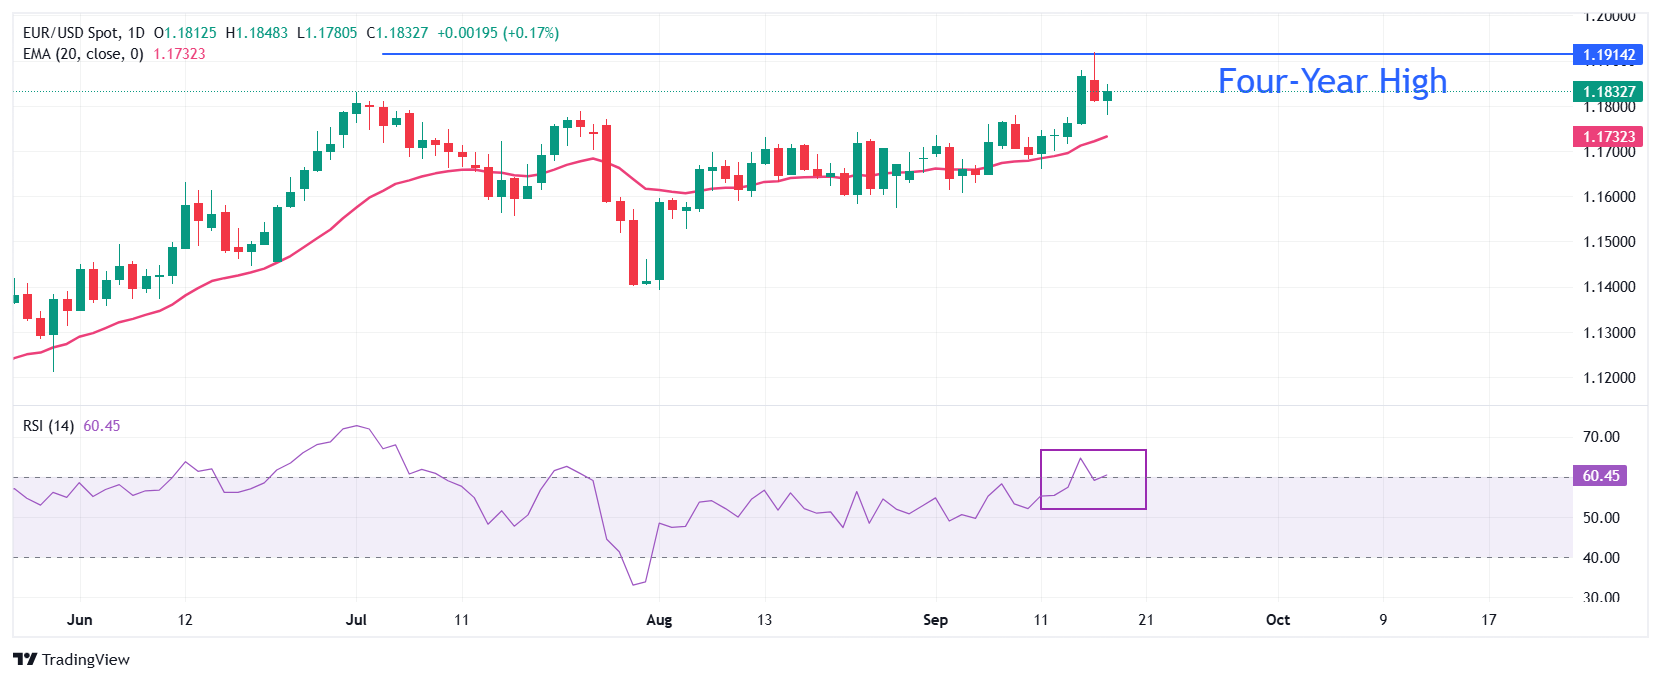
EUR/USD recovers early losses during the European trading session on Thursday and strives to reclaim its four-year high of 1.1918 posted the previous day. The near-term trend of the major currency pair remains bullish as it stays above the 20-day Exponential Moving Average (EMA), which is around 1.1730
The 14-day Relative Strength Index (RSI) holds above 60.00, signaling a fresh bullish momentum in the near term.
Looking up the psychological level of 1.2000 will be the key resistance for the major currency pair. On the downside, the September low around 1.1600 will be a key support level for the pair.
Economic Indicator
Initial Jobless Claims
The Initial Jobless Claims released by the US Department of Labor is a measure of the number of people filing first-time claims for state unemployment insurance. A larger-than-expected number indicates weakness in the US labor market, reflects negatively on the US economy, and is negative for the US Dollar (USD). On the other hand, a decreasing number should be taken as bullish for the USD.
Read more.Next release: Thu Sep 18, 2025 12:30
Frequency: Weekly
Consensus: 240K
Previous: 263K
Source: US Department of Labor
Every Thursday, the US Department of Labor publishes the number of previous week’s initial claims for unemployment benefits in the US. Since this reading could be highly volatile, investors may pay closer attention to the four-week average. A downtrend is seen as a sign of an improving labour market and could have a positive impact on the USD’s performance against its rivals and vice versa.
Author

Sagar Dua
FXStreet
Sagar Dua is associated with the financial markets from his college days. Along with pursuing post-graduation in Commerce in 2014, he started his markets training with chart analysis.

















