What’s next for Exxon Mobil?

The sellers hit a fresh multi-week low during yesterday’s session, testing important supports.
Will the way to the south be open?
As I mentioned at the beginning, the bears managed to push the price to a new low - to the lowest level since mid-March 2023! What events contributed to this deterioration? What can we expect next week? Answers to these questions you’ll find in today's article. Have a nice read!
Let’s start today’s analysis with the quote from the last commentary on Exxon Mobil published at the beginning of the year:
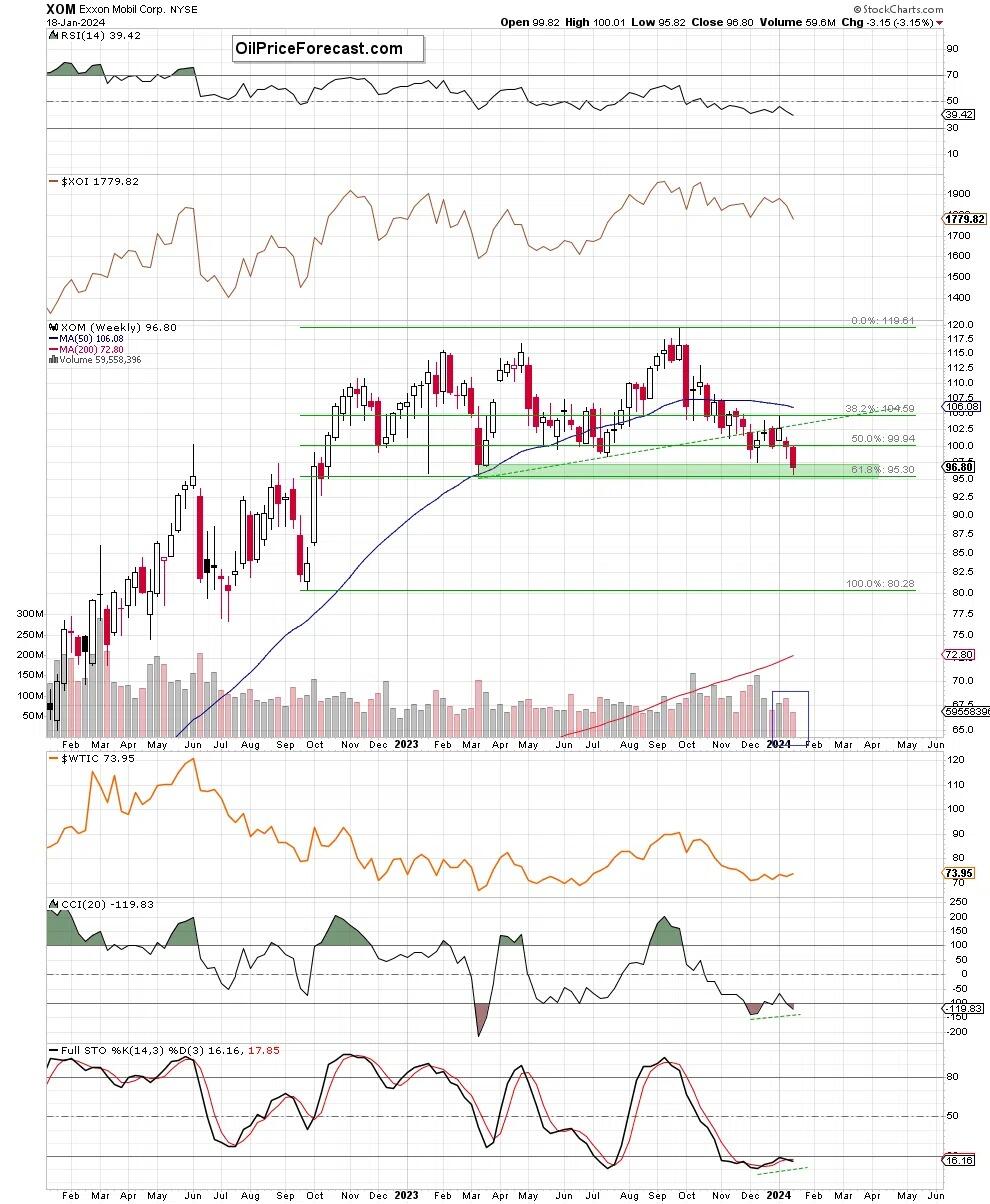
(…) what might happen if, however, the buyers fail and the bears push the price down… Well, if the sellers were able to close the green gap (marked on the daily chart), then the path to the December lows and the green support zone (95.51-97.08) seen on the weekly chart would be open.
From today’s perspective, we see that the situation developed in tune with the pro-declining scenario, and the sellers, after a battle with their opponents, were able to push the price to the above-mentioned target during yesterday’s session.
What’s next?
Before we find the answer to this question on the charts, let’s take a closer look at the daily chart and find out what happened during the recent two weeks.
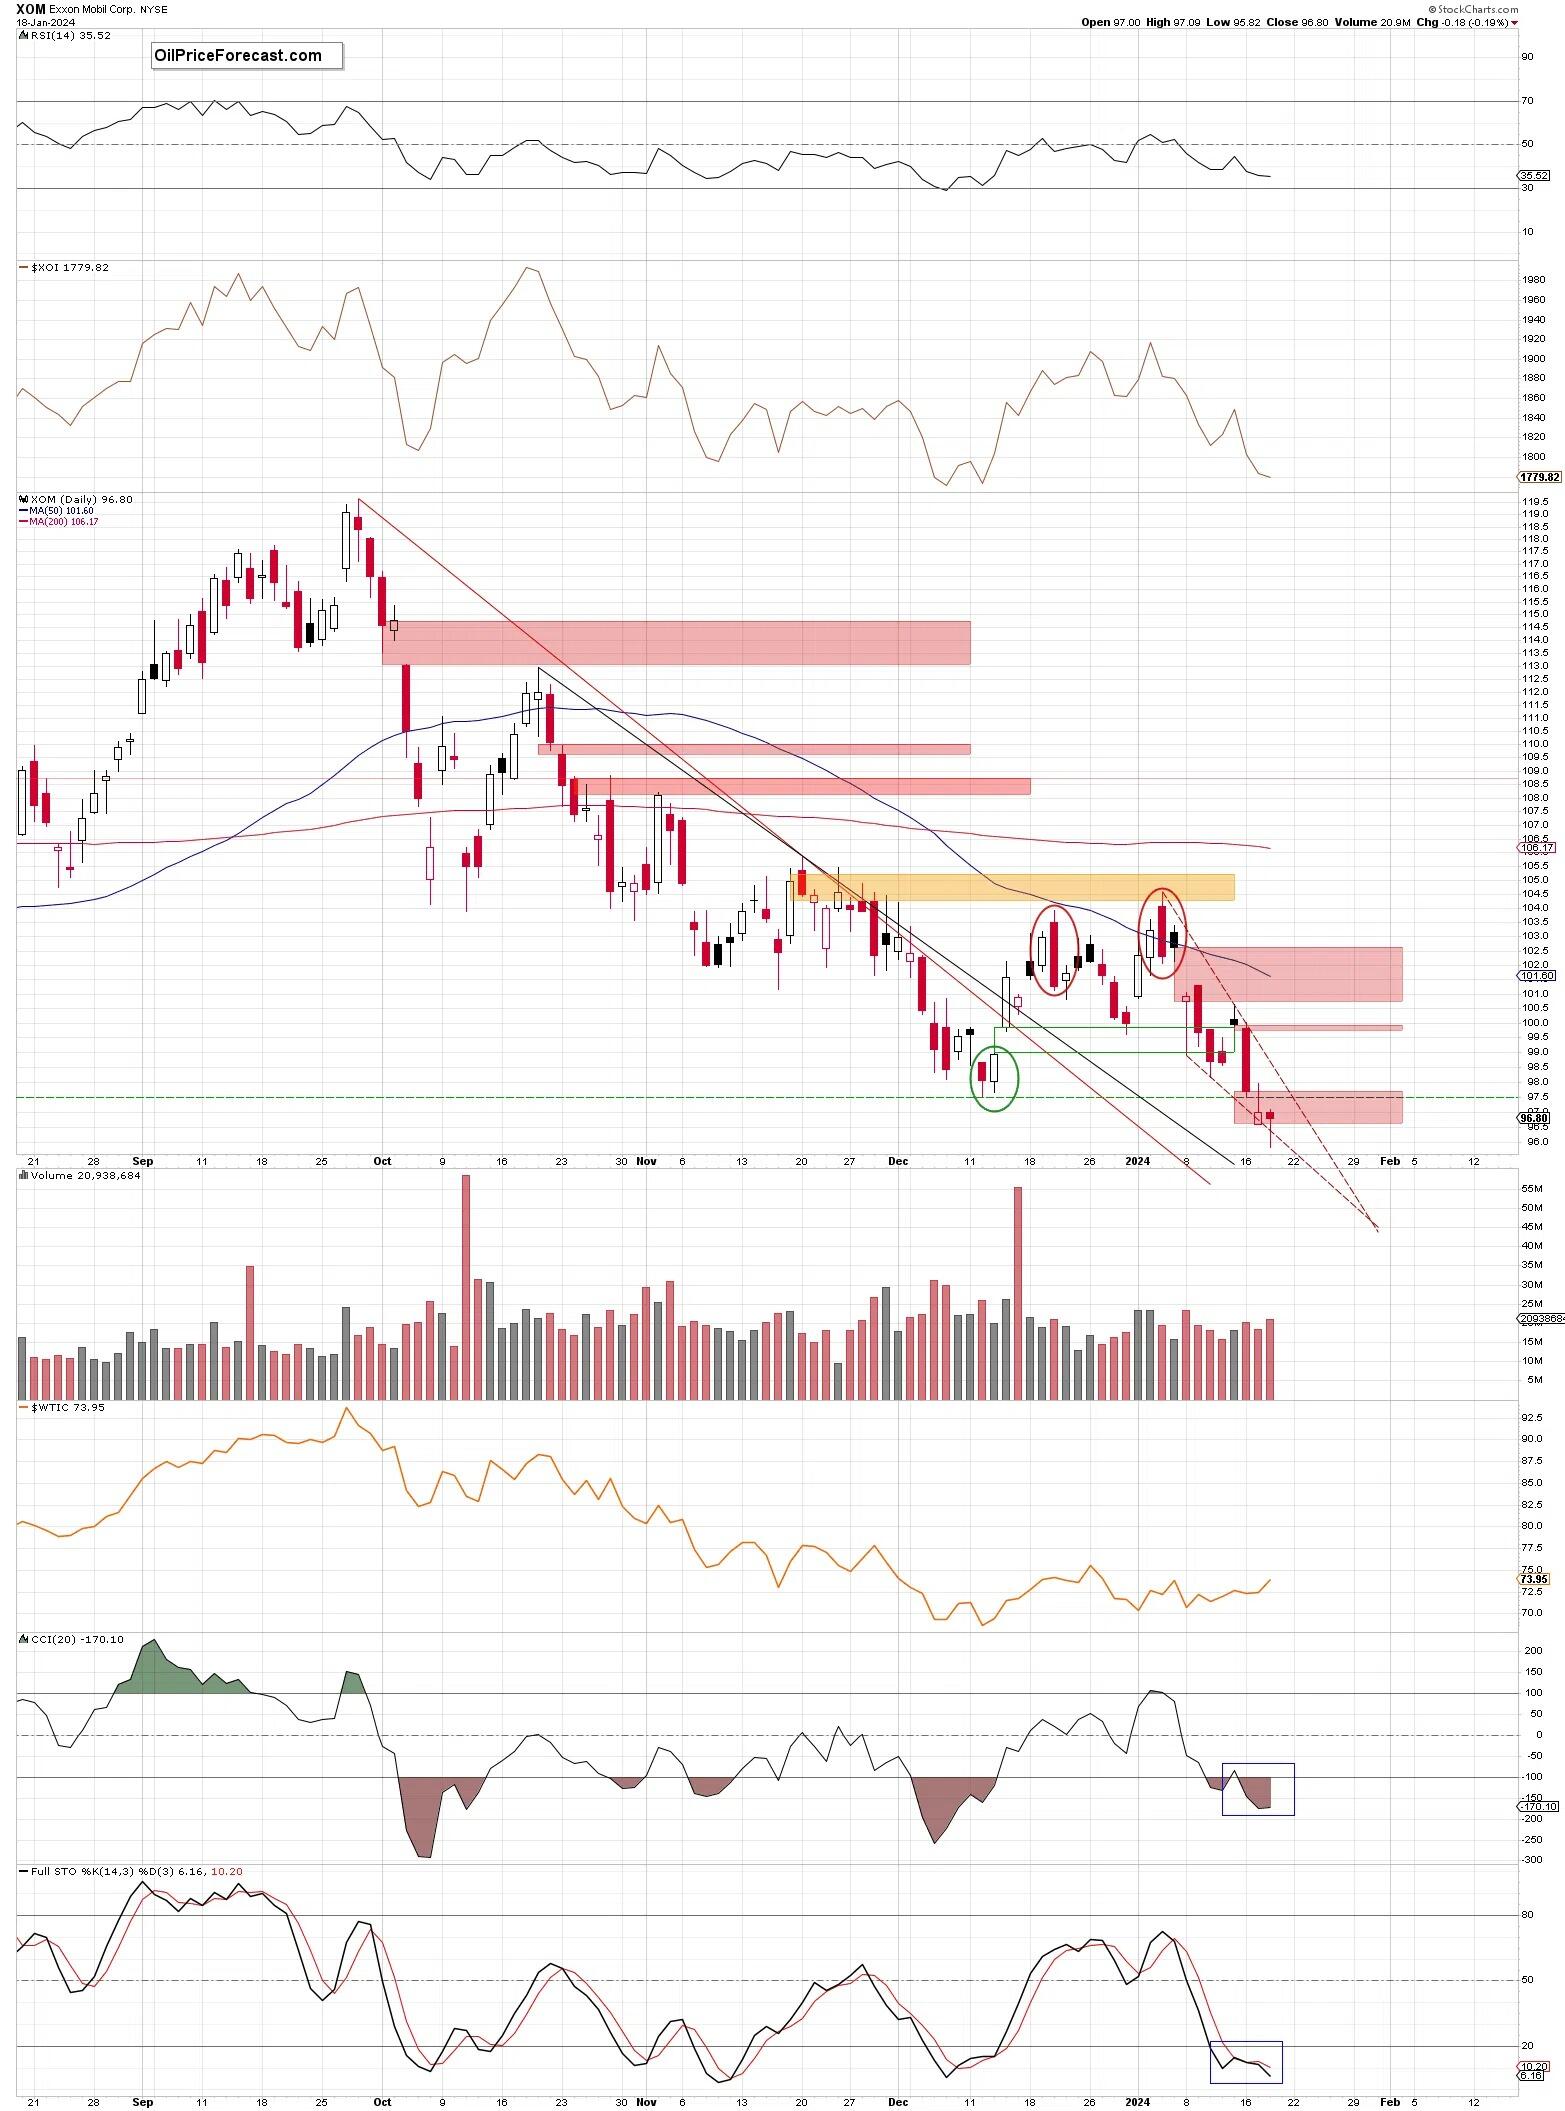
Looking at the daily chart, we see that the green gap (98.92-99.85) created on Dec. 14, 2023, was strong enough to stop the sellers at the end of the previous year and trigger a rebound in the first week of this year.
Thanks to this upswing, the bulls tested the strength of the bearish engulfing pattern (formed on Dec. 20, 2023) and the orange resistance zone. Although they managed to hit a fresh multi-week high of 104.57 on Jan.4, the combination of resistances defeated them and they collapsed under the onslaught of the bears, which resulted in a daily closure below the peak of Dec. 20, 2023.
In this way, the mentioned pro-bearish formation remained in the cards, which in combination with an invalidation of the earlier small breakout above the late-Dec. high and sell signals generated by the indicators encouraged the sellers to act once again (especially when we factor in the fact that thanks to the Jan.4 candle, they've gained another ally – a pro-declining dark cloud cover candlestick pattern).
Thanks to their attack, the price opened the following week with a big red gap, which accelerated declines and resulted in a closure of the green gap formed on Dec. 14, 2023. Although the bulls lost their important ally, they pushed the price once again on Jan. 12 and tried to close the red gap.
As you see on the chart, they failed, which translated into another red gap at the beginning of the week. This show of weakness triggered further deterioration and the sellers tested the strength of the bulls and their ally (a bullish engulfing pattern created on Dec. 13) on Wednesday.
Unfortunately (for the bulls), another disappointment occurred here, which led to the creation of a third gap and a test of the lower border of the red declining wedge and the green support zone marked on the weekly chart.
So, what’s next?
Taking into account the bulls’ weakness in recent weeks and all the above-mentioned bearish factors, it seems that going north and regaining lost levels will not be an easy challenge. In my opinion, the bulls will have to show great determination and will to fight to encourage other buyers to return to the trading floor.
What could be the first sign of improvement?
A successful breakout above the upper border of the red declining wedge (currently at around 98.14), which will also mean the closure of the first red price gap. Only such an event can be a starting point for considering changing the short-term trend, which is currently downward. In other words, until we see a clear bullish strength on the chart, another test of the lower border of the green support zone (marked on the weekly chart) and the 61.8% Fibonacci retracement can’t be ruled out.
Summing up, the very clear weakness of the bulls since the beginning of the year and the loss of a valuable ally resulted in the formation of a fresh multi-week low of 95.82 during yesterday’s session. Although the nearest supports triggered a small rebound, another test of their strength can’t be ruled out in the coming day(s).
Want free follow-ups to the above article and details not available to 99%+ investors? Sign up to our free newsletter today!
Want free follow-ups to the above article and details not available to 99%+ investors? Sign up to our free newsletter today!
Author

Przemyslaw Radomski, CFA
Gold Price Forecast
Przemyslaw Radomski, CFA (PR) is a precious metals investor and analyst who takes advantage of the emotionality on the markets, and invites you to do the same. His company, Sunshine Profits, publishes analytical software that any


