Verizon communications starts new bullish cycle

Verizon Communications Inc., commonly known as Verizon, is an US American telecommunications giant. Founded in 1983 as Bell Atlantic, it is a result of the break up of the Bell System into seven regional Baby Bells. Headquartered in New York, USA, Verizon is a part of DJIA, S&P100 and S&P500 indices. One can trade it under the ticker $VZ at NYSE.
In the initial article from July 2022, we have explained a buying idea to join the rally. As a matter of fact, we expected a zigzag lower from December 2019 highs to find support from 48.60-40.32 area. However, later on, $VZ broke $40.32 invalidation level. Now, we recognize the pattern from December 2019 peak as an Elliott wave regular flat being a 3-3-5 structure. Hereby, flat patterns can break 1.618x of the first leg. In the current blog, we discuss the wave structure of $VZ providing with next targets.
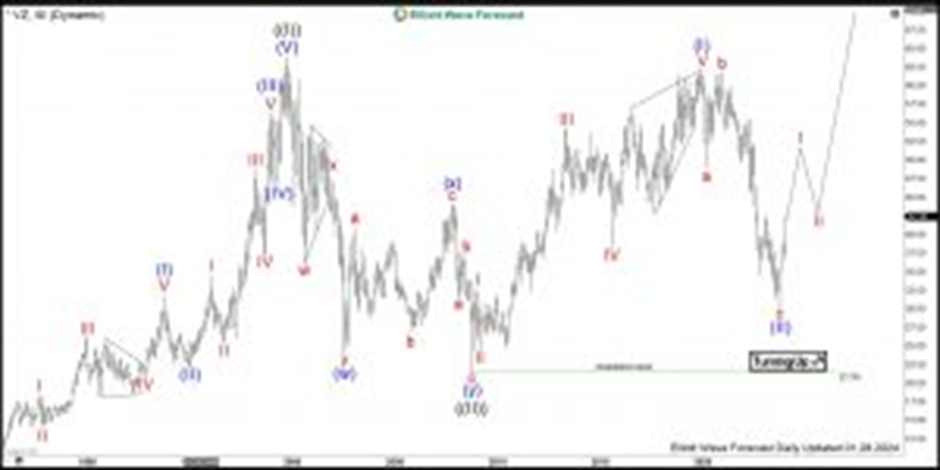
Verizon monthly Elliott Wave analysis 01.31.2024
The monthly chart below shows the Verizon stock $VZ traded at NYSE. From the all-time lows, the stock price has developed a grand super cycle in black wave ((I)) towards the all-time highs on October 1999 at 64$. Hereby, the middle part in red wave III of blue wave (III) shows a separation which is a typical feature of an impulse wave. From the October 1999 highs, a correction lower in black wave ((II)) has found its bottom in October 2008 at 21.56 low. From there, a new cycle within wave ((III)) has started and is currently in progress. The target for wave ((III)) will be 85.66-125.31 area and possibly higher.
A closer look on the wave ((III)) reveals that Verizon has developed an initial nest. Hereby, wave (I) of super cycle degree has ended in December 2019 at $62.22. From the highs, a pullback in wave (II) has unfolded as a regular flat structure. It is the preferred view that blue wave (II) has ended at October 2023 lows and next bullish cycle in blue wave (III) of black wave ((III)) has started. The target for blue wave (III) will be 70.74-95.88 area and even higher.
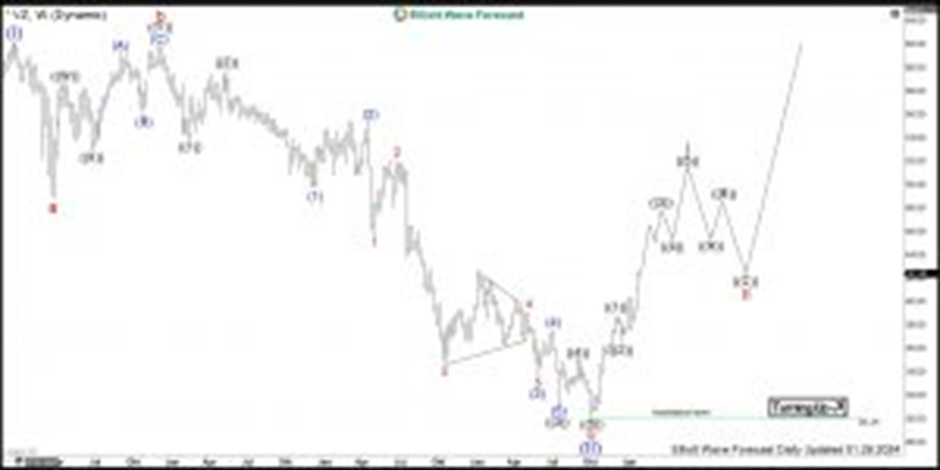
Verizon weekly Elliott Wave analysis 01.31.2024
The weekly chart below shows in more detail the pullback in blue wave (II) from December 2019 highs. It shows 3 swings as an Elliott wave regular flat pattern being 3-3-5 structure. Firstly, the cycle in red wave a has ended in March 2020 at $48.84 lows. Secondly, a bounce in connector wave b has printed a top in November 2020 at $61.95 highs. From there, the price has broken the 48.84 lows opening up a bearish sequence. Moreover, red wave c has reached more than 2.0x of the wave a. In fact, wave c of flat can surpass beyond 1.618x and even 2.0x of the wave a. It is the preferred view that flat in wave (II) has ended in October 2023.
While above $30.14 lows, next rally in blue wave (III) might be in the initial stages. Investors and traders can be looking to buy $VZ against $30.14 lows targeting 70.74-95.88 area in medium-term and 85.66-125.31 area in the long run.
Author

Elliott Wave Forecast Team
ElliottWave-Forecast.com


