|

Visa (V) shows an incomplete double correction structure

Visa Inc. (V) is an American multinational financial services corporation headquartered in San Francisco, California. It facilitates electronic funds transfers throughout the world, most commonly through Visa-branded credit cards, debit cards and prepaid cards. Visa is one of the world’s most valuable companies.

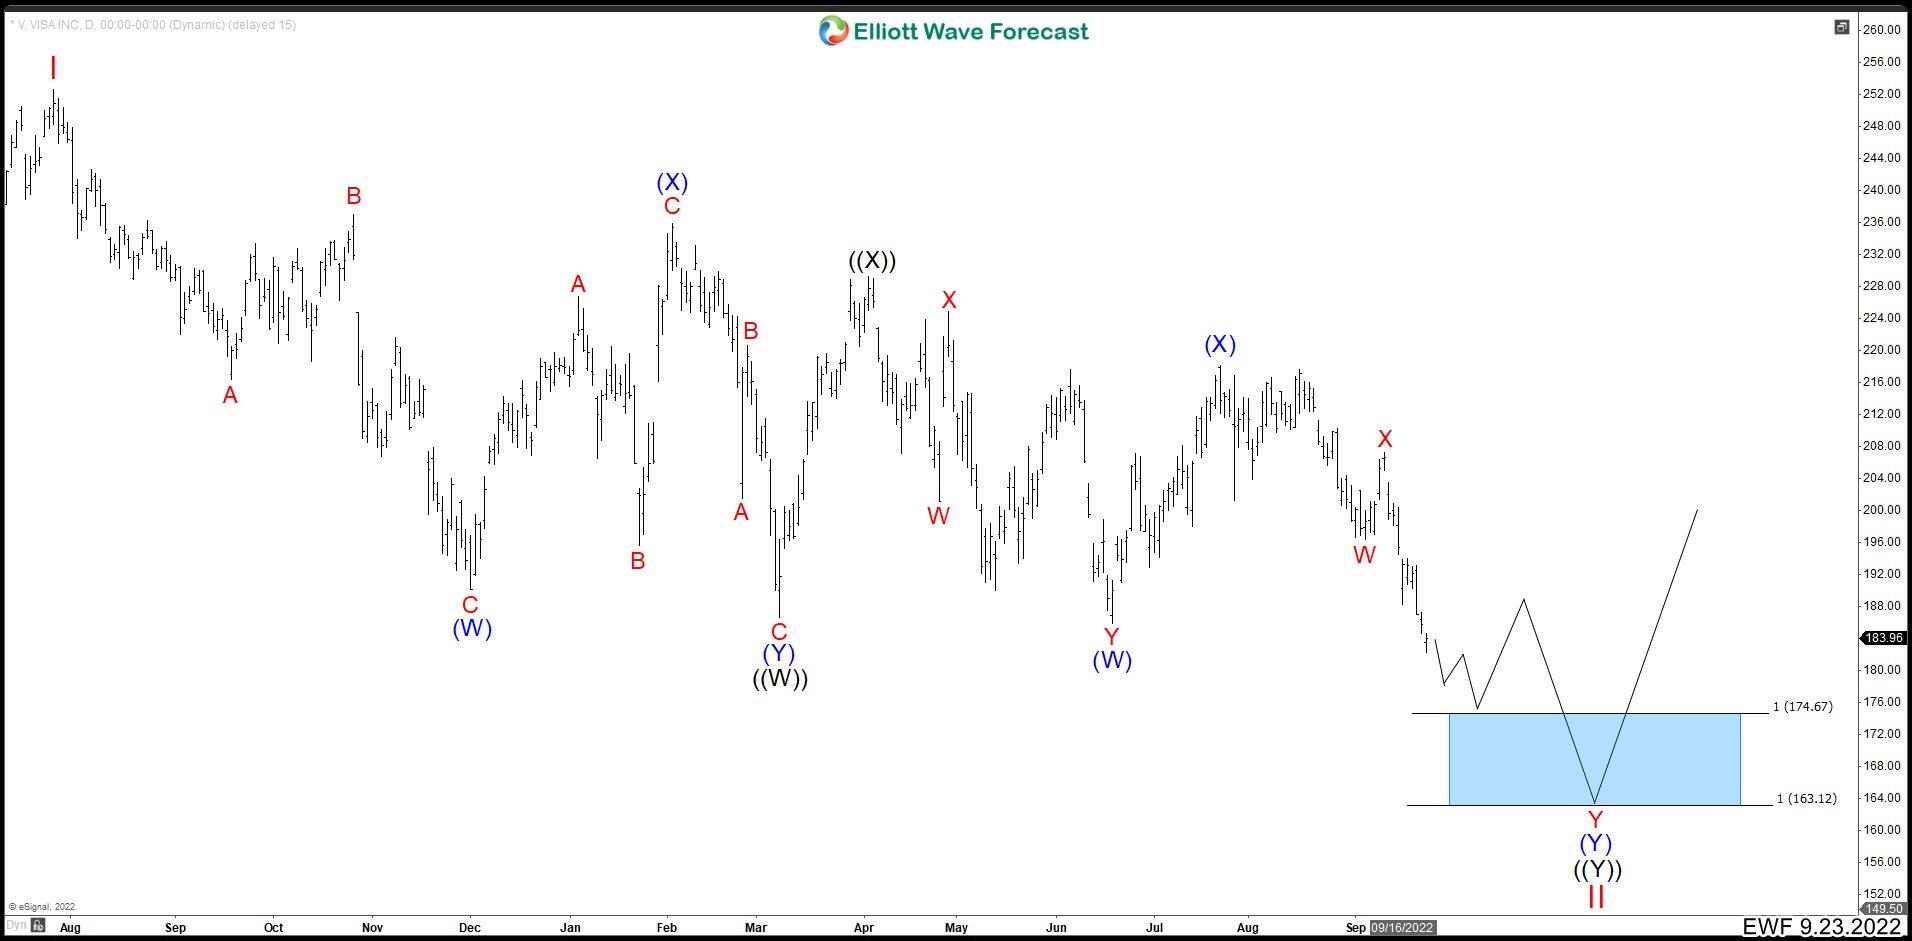
Visa (V) daily chart from September 2022

Visa

Visa (V) ended an important market cycle in July 2021 that started in aVrch 2020. The rally reached 252.67 which we labeled as wave I, and from there a corrective movement started. This structure has already had more than a year of sideways and this last September 23th we have broken an important support at 186.63. This break indicates that we should see more bearish movement until we find a new support.

Using the Elliott Wave Principle, we see that a complex 7-3-7 structure has been formed in V in daily timeframe. This means that the first cycle developed a double correction and we label it as wave ((W)). Then we have the connector ((X)) which corrected the drop from the peak. Lastly, we are building a new double correction to complete wave ((Y)). (If you want to learn more about double correction or Elliott Wave Theory, follow these links: Elliott Wave Education and Elliott Wave Theory).

Visa (V) double correction structure

From 252.57 we had 3 swing drop ending wave (W) at 190.12. Wave (X) bounced off another 3 swings to finish at 235.97. And then we saw another 3 swings to complete (Y) at 186.63 and wave ((W)). From there, we go up to 229.24 to finish the connector ((X)). The next correction came in 7 swings to complete wave (W) at 185.96. The 3 swing corrective rally completed wave (X) at 218.01 and we are currently developing wave (Y).

Wave (Y) could be building a double correction, just like wave (W). Wave W ended at 196.29 and wave X at 207.28. We expect 3 more swings down to complete wave Y in 163.12 – 174.67 area. Thus, V will complete wave (Y) of ((Y)) of wave II and then continue with the uptrend.

Author

Elliott Wave Forecast Team

Elliott Wave Forecast Team

ElliottWave-Forecast.com

More from Elliott Wave Forecast Team
Share:

Markets move fast. We move first.

Orange Juice Newsletter brings you expert driven insights - not headlines. Every day on your inbox.

By subscribing you agree to our Terms and conditions.

Editor's Picks

EUR/USD falls toward 1.1700 on broad USD recovery

EUR/USD turns south and declines toward 1.1700 on Wednesday. The US Dollar gathers recovery momentum and forces the pair to stay on the back foor, as traders look to USD short-covering ahead of US inflation report on Thursday. However, the downside could be capped by hawkish ECB expectations. 

GBP/USD trades deep in red below 1.3350 after soft UK inflation data

GBP/USD stays under strong selling pressure midweek and trades below 1.3350. The UK annual headline and core CPI rose by 3.2% each, missing estimates of 3.5% and 3.4%, respectively, reaffirming dovish BoE expectations and smashing the Pound Sterling across the board ahead of Thurday's BoE policy announcements. 

Gold clings to moderate daily gains above $4,300

Following Tuesday's volatile action, Gold regains its traction on Wednesday and trades in positive territory above $4,300. While the buildup in the USD recovery momentum caps XAU/USD's upside, the cautious market stance helps the pair hold its ground.

Bitcoin risks deeper correction as ETF outflows mount, derivative traders stay on the sidelines

Bitcoin (BTC) remains under pressure, trading below $87,000 on Wednesday, nearing a key support level. A decisive daily close below this zone could open the door to a deeper correction.

Monetary policy: Three central banks, three decisions, the same caution

While the Fed eased its monetary policy on 10 December for the third consecutive FOMC meeting, without making any guarantees about future action, the BoE, the ECB and the BoJ are holding their respective meetings this week. 

AAVE slips below $186 as bearish signals outweigh the SEC investigation closure

Aave (AAVE) price continues its decline, trading below $186 at the time of writing on Wednesday after a rejection at the key resistance zone. Derivatives positioning and momentum indicators suggest that bearish forces still dominate in the near term.