Visa Inc.(V) Elliott Wave technical analysis [Video]
![Visa Inc.(V) Elliott Wave technical analysis [Video]](https://editorial.fxstreet.com/images/Markets/Equities/DowJones/dow-jones-industrial-average-on-iphone-19534758_XtraLarge.jpg)
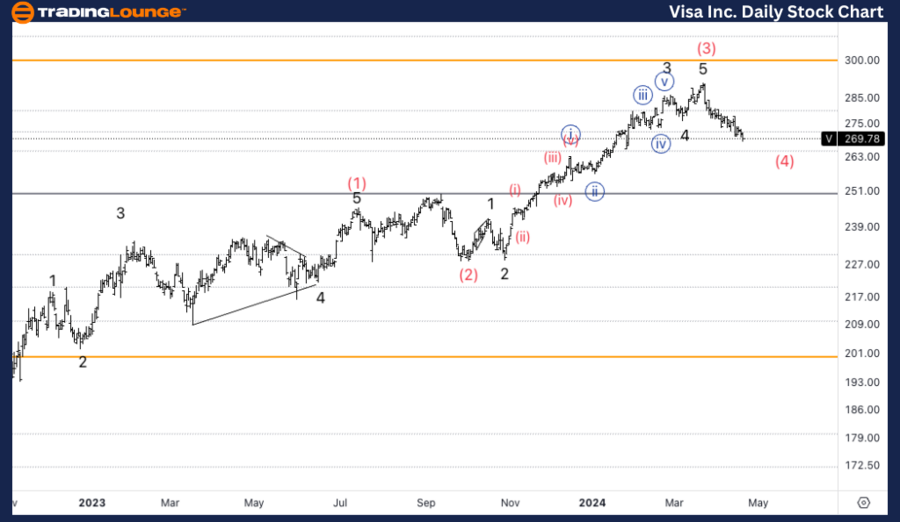
V Elliott Wave Analysis Trading Lounge Daily Chart,
Visa Inc., (V) Daily Chart.
V Elliott Wave technical analysis
Function: Counter Trend.
Mode: Corrective.
Structure: ZigZag.
Position: Intermediate wave (4).
Direction: Bottom in wave (4).
Details: We are entertaining the idea of an Intermediate wave (3) in place, as the current correction, given its magnitude, seems to be paring up with the same degree wave (2).
On April 22, 2024, our Elliott Wave analysis delves into Visa Inc. (Ticker: V), providing valuable insights into its daily and 4-hour chart movements. This analysis aims to offer investors actionable information to navigate the market effectively.
V Elliott Wave technical analysis – Daily chart
Our analysis reveals that Visa is currently undergoing a corrective counter trend phase, characterized by a ZigZag structure, identified as Intermediate wave (4). The direction indicates a potential bottoming out in wave (4). We are exploring the possibility of Intermediate wave (3) completion, given the correction's magnitude, aligning with a wave (2) of the same degree.
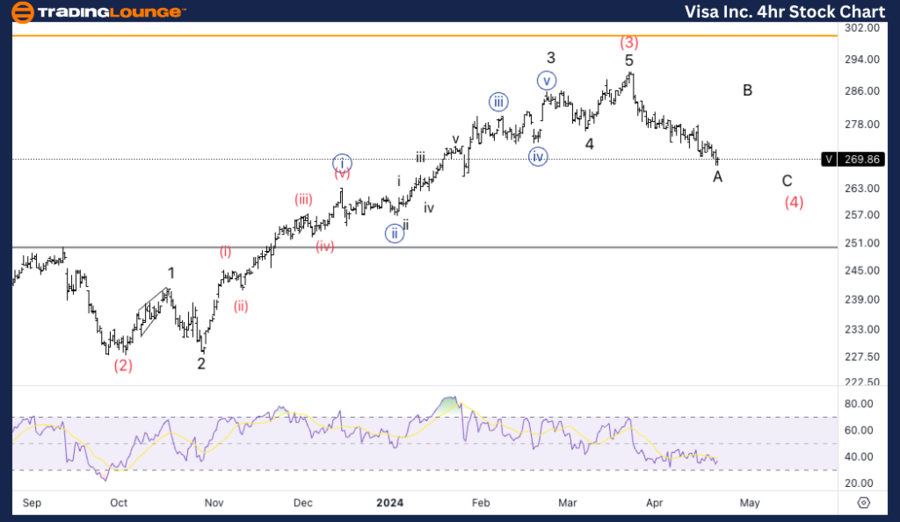
V Elliott Wave Analysis Trading Lounge 4Hr Chart, April
Super Micro Computer Inc., (V) 4Hr Chart
V Elliott Wave technical analysis
Function: Counter Trend.
Mode: Corrective.
Structure: ZigZag.
Position: Intermediate wave (4).
Direction: Bottom in wave A of (4).
Details: Looking for either a bottom in wave A as RSI bullish divergence also seems to be suggesting, or else we’ve have a sharp wave (4), to alternate with the sideways wave (2).
V Elliott Wave technical analysis – Four-hour chart
Zooming into the 4-hour chart, Visa's corrective phase continues within Intermediate wave (4), specifically focusing on wave A. Our analysis suggests that the correction may have found a bottom in wave A, supported by bullish divergence observed in the Relative Strength Index (RSI). Alternatively, there is a possibility of a sharp wave (4) unfolding, alternating with a sideways wave (2) pattern.
Technical analyst: Alessio Barretta.
V Elliott Wave technical analysis [Video]
Author

Peter Mathers
TradingLounge
Peter Mathers started actively trading in 1982. He began his career at Hoei and Shoin, a Japanese futures trading company.


