|

Visa Inc. (V) Elliott Wave technical analysis [Video]

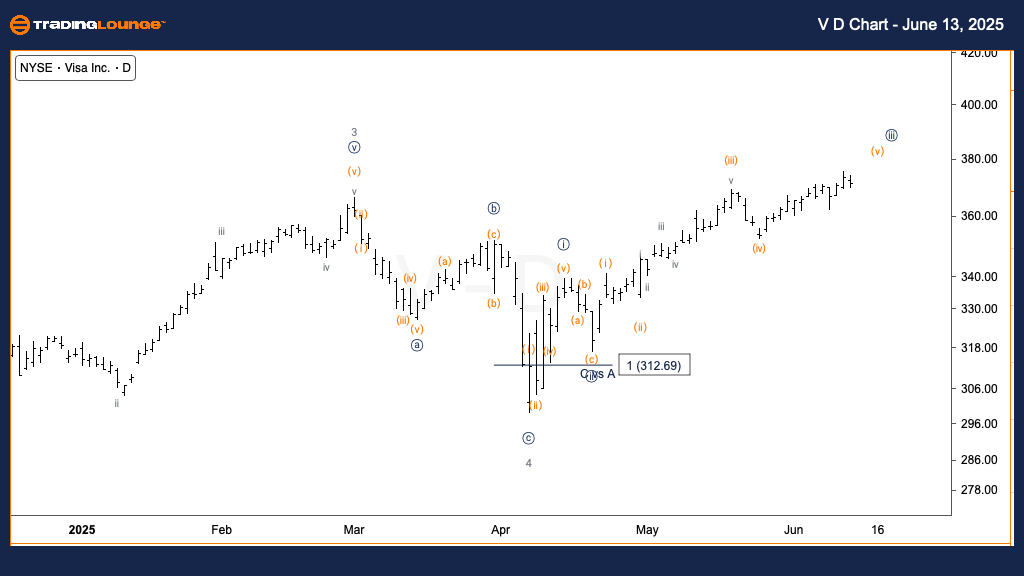
V Elliott Wave Analysis - Daily chart

Function: Trend.

Mode: Impulsive.

Structure: Motive.

Position: Wave {iii} of 5.

Direction: Uptrend in wave {iii}.

Details: Approaching potential peak at $380 (MinorGroup2); possible sideways wave {iv} correction may follow.

The daily chart analysis of Visa Inc. (V) reflects a strong bullish trend, with the stock currently in wave {iii} of primary wave 5. Price action is nearing a potential resistance zone at $380, identified as the top of Minor Group2. At this level, a profit-taking phase or temporary sideways movement could emerge, forming wave {iv} before the uptrend resumes.

Chart

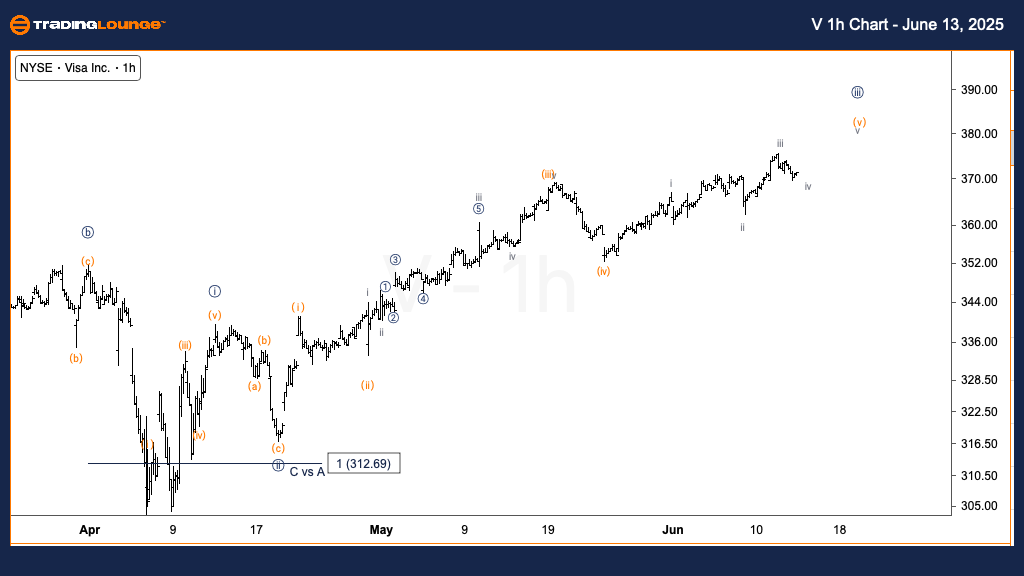
Visa Inc. (V) – One-hour chart

Function: Trend.

Mode: Impulsive.

Structure: Motive.

Position: Wave iii of (v).

Direction: Continued uptrend in wave v.

Details: Currently in wave iv, setting up for final push in wave (v).

On the 1-hour chart, Visa appears to be in wave iv of (v), suggesting that the market is preparing for one more upward movement to complete wave (v). This expected move aligns with the daily chart’s projection towards $380, reinforcing the potential top scenario in wave {iii}.

Chart

Summary

Visa Inc. (V) is exhibiting a strong impulsive trend structure across both daily and intraday timeframes. The current setup points to a nearing short-term high, with potential for consolidation before continuing upward momentum. Traders should watch for confirmation of wave {iv} and wave (v) patterns as the stock approaches the $380 level.

Visa Inc. (V) Elliott Wave technical analysis [Video]

Author

Peter Mathers

Peter Mathers

TradingLounge

Peter Mathers started actively trading in 1982. He began his career at Hoei and Shoin, a Japanese futures trading company.

More from Peter Mathers
Share:

Editor's Picks

AUD/USD falls to near 0.7100 after slipping below 50-day EMA

AUD/USD depreciates after registering minor gains in the previous day, trading around 0.7120 during the Asian hours. The technical analysis of the daily chart shows the pair consolidating sideways within a rectangle pattern, as neither bulls nor bears gain control. The AUD/USD pair is holding a slight bearish tone however as it sits beneath both the nine-day and 50-day EMAs.

160.00: USD/JPY back near intervention territory after upbeat US jobs report

US Nonfarm Payrolls beat expectations by a wide margin in May, with 172K jobs added. The US Dollar rebounds after the release, helping USD/JPY recover from its intraday lows. Warnings from Japanese authorities continue to limit upside potential near the 160.00 threshold.

Gold targets $4,300 amid stronger Dollar

Gold faces increasing selling interest and navigates the area of three-month lows near the $4,300 mark per troy ounce on Friday. The precious metal’s decline comes as traders assess the stronger-than-expected NFP, while the bid bias in the Greenback and higher US Treasury yields also collaborate with the retracement.

Cardano hits five-year low even as Hoskinson clarifies "break" isn't an exit

Cardano (ADA) price is down 10% at press time on Friday, extending losses over 30% so far this week amid Charles Hoskinson's clarification that "break" isn't an exit.

Week ahead – Fed countdown begins amid US inflation data and geopolitical risks

Fed Chair Warsh’s first meeting approaches as key US inflation data could reshape expectations. Oil prices remain elevated as US-Iran talks continue; tariffs also return to the spotlight. ECB is expected to hike; will it be a one-off move or is July live?

The US economy defies the rules: 100 days into the Oil shock and the recession signal is still missing

More than three months after the start of the Iran war and the resulting disruption to global energy markets, the US economy continues to display remarkable resilience. The conflict has triggered a sharp rise in Oil prices, reignited inflationary pressures and fueled widespread concerns about a potential economic slowdown.