Visa Inc. (V) Elliott Wave technical analysis [Video]
![Visa Inc. (V) Elliott Wave technical analysis [Video]](https://editorial.fxstreet.com/images/TechnicalAnalysis/ChartPatterns/Chartism/stock-market-chart-79297425_XtraLarge.jpg)
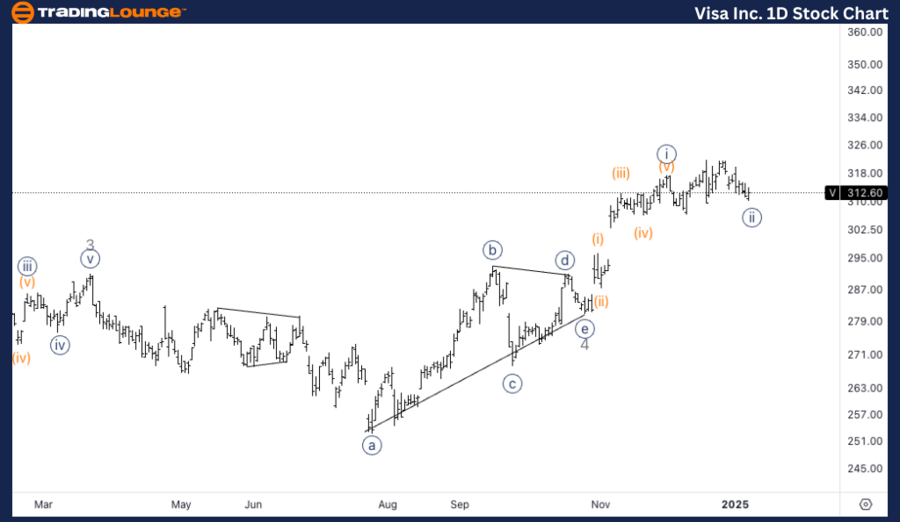
V Elliott Wave technical analysis
Function: Trend.
Mode: Impulsive.
Structure: Motive.
Position: Wave {ii} of 5.
Direction: Upside in wave 5.
Details: Looking for upside into what appears to be the last leg of Intermediate wave (1). As we keep trading above 300$ we could expect further upside towards Medium Level at 400$.
V Elliott Wave technical analysis – Daily chart
Visa is likely in the process of completing wave {ii} of the larger wave 5. After this corrective phase, we expect the uptrend to resume, leading to further upside within wave 5. Trading above $300 indicates that there is potential for more gains, with the next major target at MediumLevel 400. As long as the price remains supported above this $300 level, the bullish outlook remains intact.
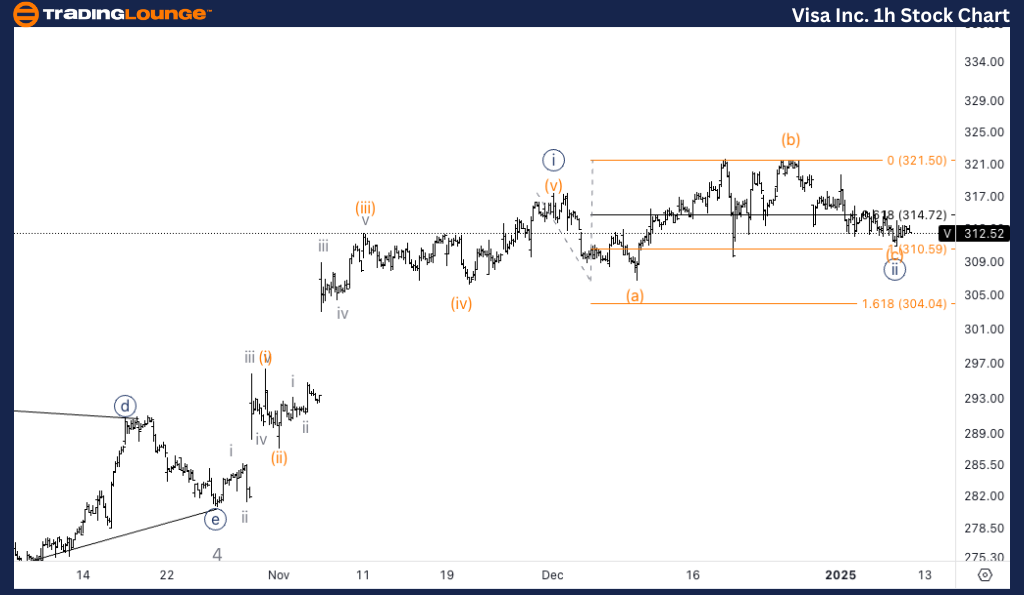
V Elliott Wave technical analysis
Function: Trend.
Mode: Impulsive.
Strucutre: Motive.
Position: Wave {ii} of 5.
Direction: Bottom in wave (c) of {ii}.
Details: Looking for a bottom in wave (c) as we seem to have reached equality of (c) vs. (a) at 310$. Looking for confirmation higher with tested support on top of 320$.
V Elliott Wave technical analysis – One-hour chart
On the 1-hour chart, Visa appears to be bottoming in wave (c) of {ii}, as it has reached equality between (c) and (a) at around $310. We are looking for signs of a bullish reversal, with a key confirmation point if the price tests and holds support above $320. Once support is confirmed, the uptrend in wave 5 is likely to resume.
This analysis of Visa Inc., (V) focuses on both the daily and 1-hour charts, using the Elliott Wave Theory to assess current market trends and forecast future price movements.
Visa Inc. (V) Elliott Wave technical analysis [Video]
Author

Peter Mathers
TradingLounge
Peter Mathers started actively trading in 1982. He began his career at Hoei and Shoin, a Japanese futures trading company.


