Virgin Galactic Stock Price and News: Why did SPCE stock crash land on Thursday?
- SPCE shares collapsed on Thursday, closing 19% lower.
- Virgin Galactic announced a debt raise to fund operations.
- SPCE shares have shed nearly 70% in the last six months.

Virgin Galactic (SPCE) remained true to recent form and once again hit investors in the stock hard on Thursday. This one has been steadily sliding lower since last summer and shows little sign of an imminent lift-off, pun intended. Virgin Galactic (SPCE) stock hit a high of $57 back in June, nearly matching the $62.80 meme stock madness high from February last year. Currently, Virgin (SPCE) shares are trading at $10 and looking likely to head further south. This is not a good investment and a further sign that the meme stock space could be over.
Virgin Galactic Stock News
So why the increased sell-off yesterday? Well, Virgin Galactic needs cash and plenty of it. The company announced yesterday that it would raise up to $500 million in debt. The majority, $425 million, is to come from 2027 convertible senior notes. The company admitted it needed the cash for working capital, general administrative matters and capital expenditures. In other words, it needs the cash to survive in our view. Amazingly, the notes carry a 2.5% rate. I would certainly be looking for more to loan them my money, but that is the low yield world we currently find ourselves in. Using convertible notes has the potential to dilute shareholders as holders of the debt have the right to convert into ordinary shares in SPCE if certain terms are met. The company has, however, taken steps using a capped call to alleviate this.
"Virgin Galactic will settle conversions by paying or delivering, as applicable, cash, shares of its common stock or a combination of cash and shares of its common stock, par value $0.0001 per share (the "common stock"), at its election, based on the conversion rate. The initial conversion rate is 78.1968 shares of common stock per $1,000 principal amount of notes, which represents an initial conversion price of approximately $12.79 per share of common stock. The initial conversion price represents a premium of approximately 27.5% over the last reported sale price of $10.03 per share of Virgin Galactic's common stock on January 13, 2022. The conversion rate and conversion price will be subject to adjustment upon the occurrence of certain events."
It continues: "The notes will be redeemable, in whole or in part (subject to certain limitations), for cash at Virgin Galactic's option at any time, and from time to time, on or after February 6, 2025 and on or before the 20th scheduled trading day immediately before the maturity date, but only if the last reported sale price per share of Virgin Galactic's common stock exceeds 130% of the conversion price for a specified period of time and certain liquidity conditions have been satisfied. The redemption price will be equal to the principal amount of the notes to be redeemed, plus accrued and unpaid interest, if any, to, but excluding, the redemption date."
Virgin Galactic Stock Forecast
What the above means in our opinion is that the debt can be converted into ordinary shares at any stage by the holder of the debt. So it is a call option with a $12.79 strike. Well, that is our reading of the press release. We cannot see if the conversion is at the behest of the holder or just Virgin Galactic as specified above. The release says the notes will be redeemable for cash but does not say when and how holders can convert to ordinary shares. Usually, a vanilla convertible means holders can exercise and decide when to convert, a mandatory conversion is at the discretion of the company.
Anyway, the trend is ugly, very ugly, in this one. Breaking $14.50 was huge support, which we had identified some time ago. Once this went, it led to the next target being $9.06, the low from March 2020. This looks likely to be tested shortly.
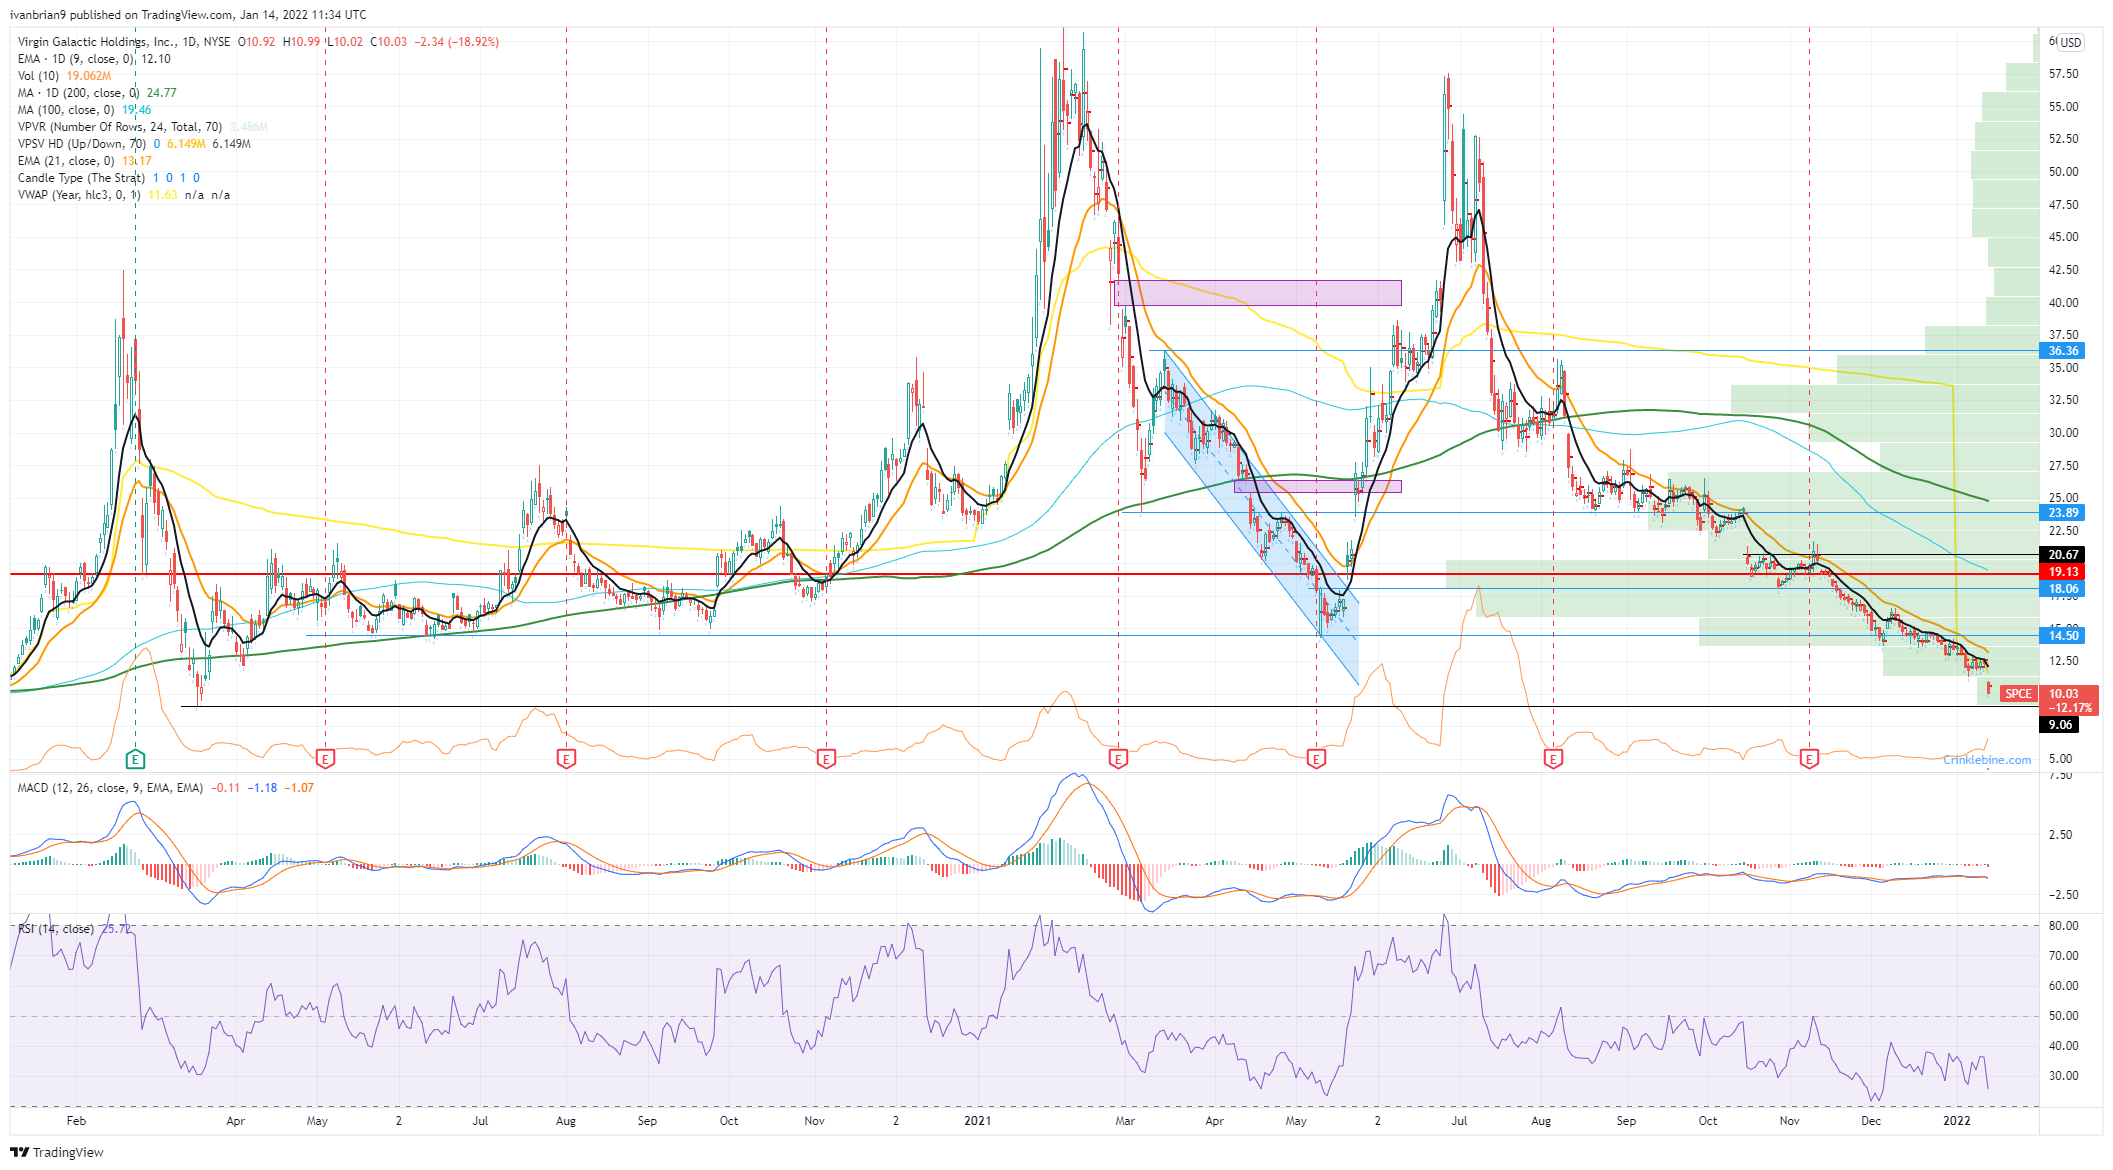
Virgin Galactic (SPCE) chart, daily
Like this article? Help us with some feedback by answering this survey:
Author

Ivan Brian
FXStreet
Ivan Brian started his career with AIB Bank in corporate finance and then worked for seven years at Baxter. He started as a macro analyst before becoming Head of Research and then CFO.


