USD/JPY Price Analysis: Drops toward the 78.6% Fibo level at 136.60s as bulls take a respite
- The USD/JPY failed to gain traction despite rising US Treasury yields.
- USD/JPY Price Analysis: Remains upward biased, though a pullback toward 136.00 is on the cards.

The USD/JPY fell after testing the 20-day Exponential Moving Average (EMA) around 137.88 and dropped below the 137.00 mark in the North American session amid a risk-off impulse. At the time of writing, the USD/JPY is trading at 136.63, below its opening price by 0.84%, after hitting a high of 137.80.
USD/JPY Price Analysis: Technical outlook
From a daily chart perspective, the USD/JPY remains range-bound, within the boundaries of the 20-day EMA and the 200-day EMA, each at 137.88-135.14, respectively. The Relative Strength Index (RSI), at bearish territory, aims downward, while the Rate of Change (RoC) is almost flat, signaling that buying pressure has faded.
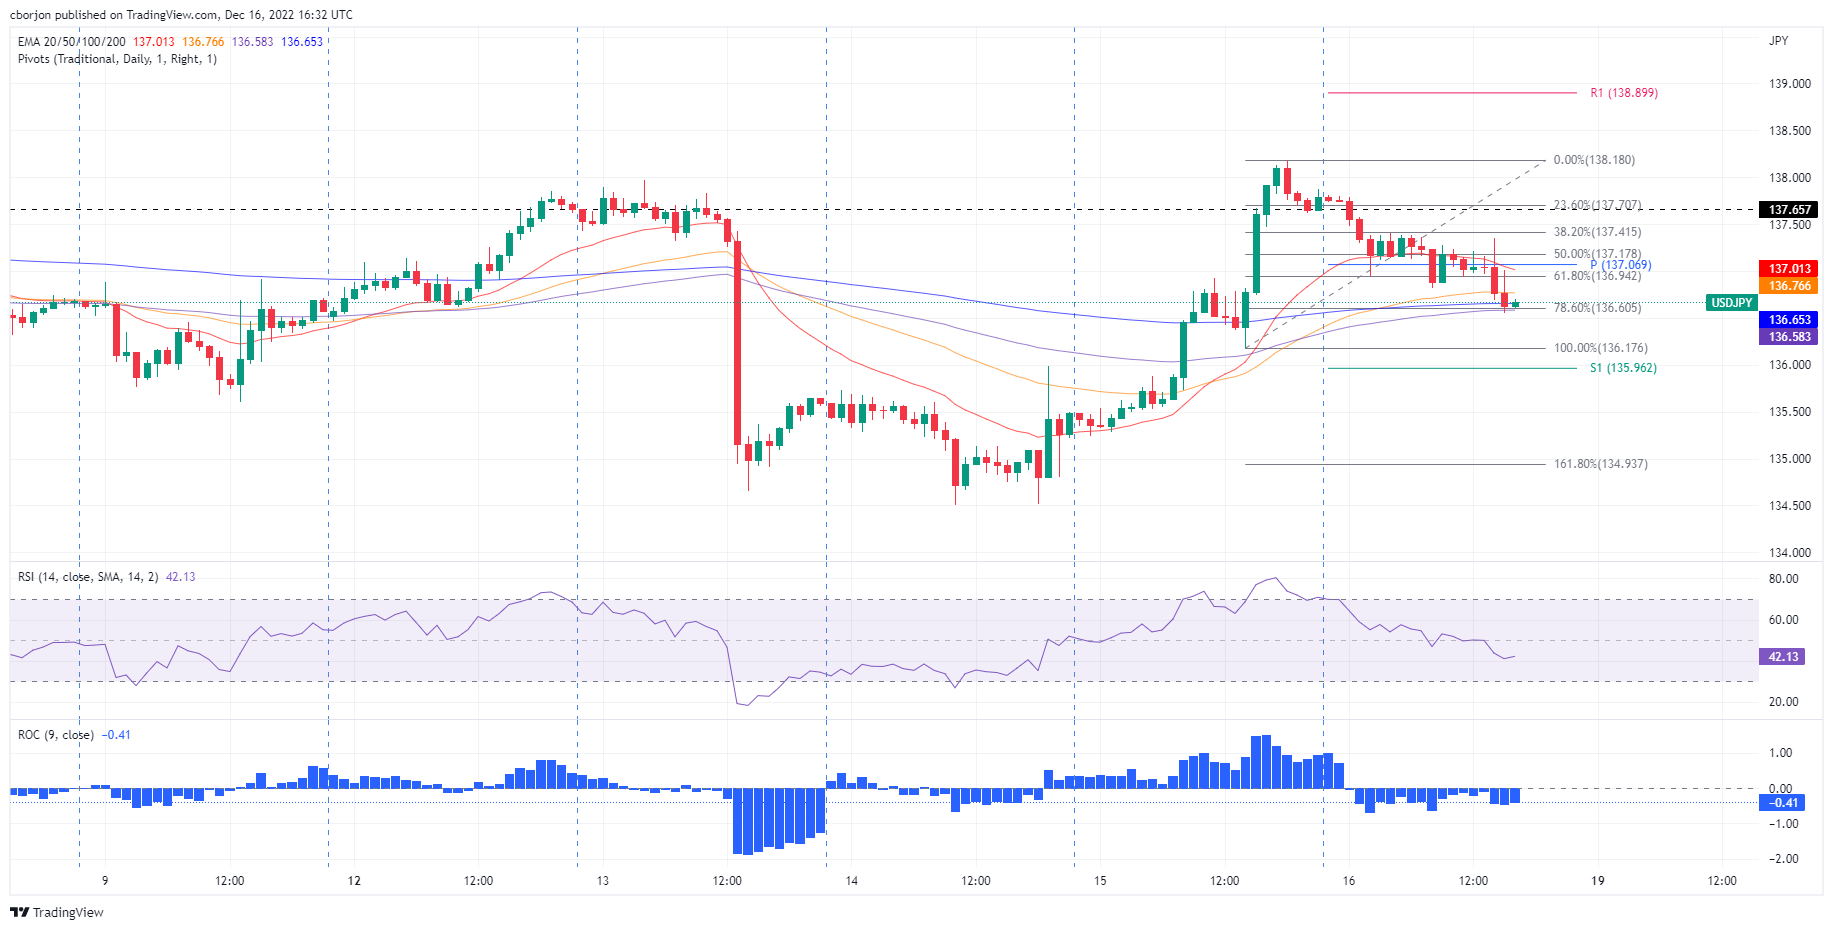
Short term, the USD/JPY one-hour chart suggests that buyers are taking a respite after hitting 138.17. The major dived towards the confluence of the 78.6% Fibonacci retracement and the 100-EMA around 136.60, appearing to find support. Nevertheless, if the latter is breached, a fall toward the S1 daily pivot at 135.96 is on the cards. Contrarily, if the USD/JPY rallies toward the 61.8% Fibonacci level at 136.96, a test of the 137.00 figure is likely. Break above will expose the December 13 daily high at 137.97, ahead of the 138.00 mark.
USD/JPY Key Technical Levels
Author

Christian Borjon Valencia
FXStreet
Markets analyst, news editor, and trading instructor with over 14 years of experience across FX, commodities, US equity indices, and global macro markets.


