|

USD/ZAR Price Analysis: Rises 0.30%, gains could be short-lived

  • USD/ZAR looks south with a range breakdown on the daily chart. 
  • Key indicators favor a test of deeper support levels. 

USD/ZAR is trading at 17.1773 at press time, representing a 0.30% gain on the day. 

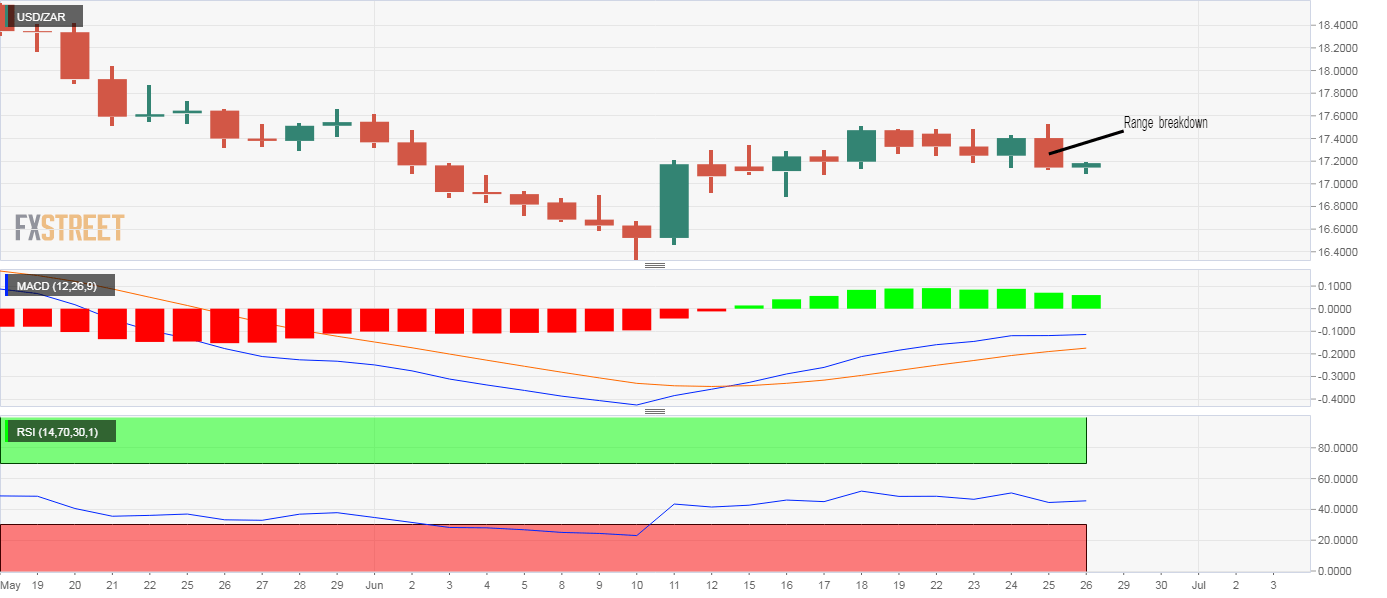
The bounce could be short-lived, as the daily chart studies are reporting bearish conditions. To start with, Thursday's 1.34% decline, the biggest single-day decline since May 21, confirmed a downside break of the narrow trading range of 17.1670-17.50. 

The range breakdown suggests the bounce from the June 10 low of 16.3204 has ended and the bears have regained control. In addition, the 14-day relative strength index is hovering in bearish territory below 50 and the MACD histogram is beginning to chart lower bars above the zero line, a sign of weakening of upward momentum. 

The pair risks falling to the psychological support of 17.00, which, if breached, would shift the focus to 16.3204. A close above Thursday's high of 17.5303 is needed to restore the bullish view. 

Daily chart

Trend: Bearish

Technical levels

USD/ZAR

Overview
Today last price17.1773
Today Daily Change0.0340
Today Daily Change %0.20
Today daily open17.1433
 
Trends
Daily SMA2017.1139
Daily SMA5017.8811
Daily SMA10017.2382
Daily SMA20015.951
 
Levels
Previous Daily High17.5322
Previous Daily Low17.1257
Previous Weekly High17.5104
Previous Weekly Low16.8922
Previous Monthly High18.9592
Previous Monthly Low17.2921
Daily Fibonacci 38.2%17.281
Daily Fibonacci 61.8%17.3769
Daily Pivot Point S117.0019
Daily Pivot Point S216.8606
Daily Pivot Point S316.5954
Daily Pivot Point R117.4084
Daily Pivot Point R217.6735
Daily Pivot Point R317.8149


Author

Omkar Godbole

Omkar Godbole

FXStreet Contributor

Omkar Godbole, editor and analyst, joined FXStreet after four years as a research analyst at several Indian brokerage companies.

More from Omkar Godbole
Share:

Editor's Picks

EUR/USD deflates to fresh lows, targets 1.1600

The selling pressure on EUR/USD now gathers extra pace, prompting the pair to hit fresh multi-week lows in the 1.1625-1.1620 band on Friday. The continuation of the downward bias comes in response to further gains in the US Dollar as market participants continue to assess the mixed release of US Nonfarm Payrolls in December.

GBP/USD breaks below 1.3400, challenges the 200-day SMA

GBP/USD remains under heavy fire and retreats for the fourth consecutive day on Friday. Indeed, Cable suffers the strong performance of the Greenback, intensified post-mixed NFP, and trades at shouting distance from its critical 200-day SMA near 1.3380.

Gold flirts with yearly tops around $4,500

Gold keeps its positive bias on Friday, adding to Thursday’s advance and challenging yearly highs in the $4,500 region per troy ounce. The risk-off sentiment favours the yellow metal despite the firmer tone in the Greenback and rising US Treasury yields.

Crypto Today: Bitcoin, Ethereum, XRP risk further decline as market fear persists amid slowing demand

Bitcoin holds $90,000 but stays below the 50-day EMA as institutional demand wanes. Ethereum steadies above $3,000 but remains structurally weak due to ETF outflows. XRP ETFs resume inflows, but the price struggles to gain ground above key support.

Week ahead – US CPI might challenge the geopolitics-boosted Dollar

Geopolitics may try to steal the limelight from US data. A possible US Supreme Court ruling on tariffs could dictate market movements. A crammed data calendar next week, US CPI comes on Tuesday; Fedspeak to intensify.

XRP trades under pressure amid weak retail demand

XRP presses down on the 50-day EMA support as risk-averse sentiment spreads despite a positive start to 2026. XRP faces declining retail demand, as reflected in futures Open Interest, which has fallen to $4.15 billion.