|

USD/ZAR Price Analysis: Rand looks set to reclaim 19.00 ahead of South Africa GDP

  • USD/ZAR drops to the lowest levels in two weeks during four-day downtrend.
  • Bears cheer downside break of 100-SMA, previous support line from mid-May.
  • 200-SMA can prod South African Rand buyers amid oversold RSI conditions.
  • South Africa Gross Domestic Product appears the key data to watch for clear directions.

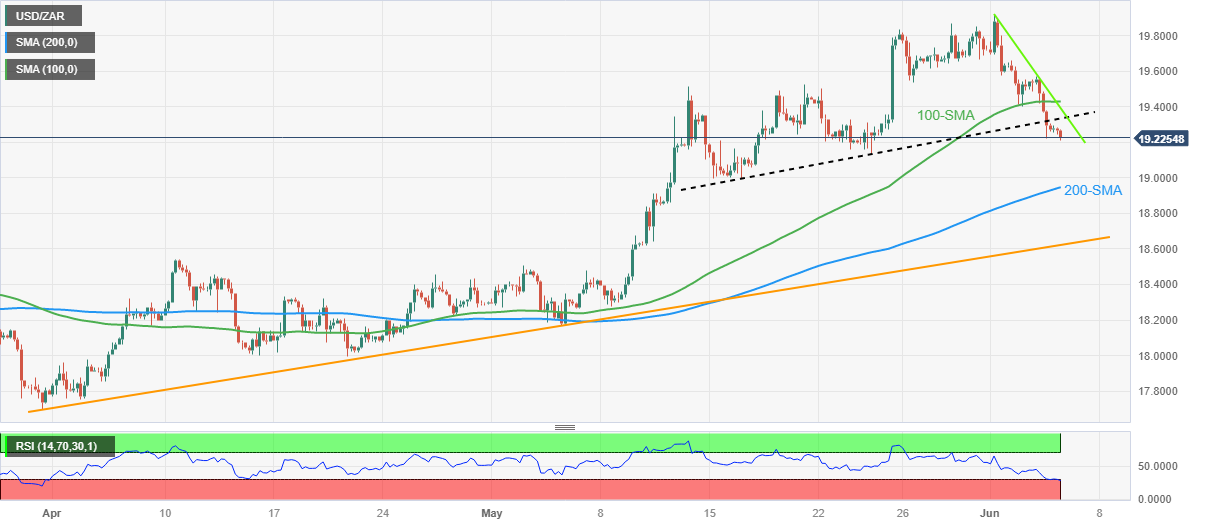
USD/ZAR bears stay in the driver’s seat for the fourth consecutive day after it refreshed an all-time high in the last week. That said, the South African Rand (ZAR) pair drops to the fresh low in a fortnight while taking offers to 19.21 ahead of the South After Gross Domestic Product (GDP) release, scheduled for publishing at 09:30 AM GMT on Tuesday.

Although the GDP data is less likely to allow the USD/ZAR sellers to keep the reins, technical details are favoring further downside of the quote.

That said, a clear break of the 100-SMA and a three-week-old support-turned-resistance adds strength to the bearish bias about the USD/ZAR pair. The same direct the sellers toward the mid-May low surrounding the 19.00 round figure.

However, the oversold RSI conditions appear to challenge the USD/ZAR bears around the 200-SMA level of 18.94.

Following that, an upward-sloping support line from late March, close to 18.62 at the latest, appears the last defense of the USD/ZAR buyers.

On the flip side, the USD/ZAR recovery needs to cross the previous support line and a one-week-old descending resistance line, respectively near 19.33 and 19.39.

Should the quote manages to remain firmer past 19.39, the 19.40 round figure and the 100-SMA level of around 19.43 may challenge the USD/ZAR bulls.

Overall, USD/ZAR is likely to decline further but the South African GDP has a history of disappointing optimists and the same prods the pair sellers.

USD/ZAR: Four-hour chart

Trend: Further downside expected

Additional important levels

Overview
Today last price19.2328
Today Daily Change-0.0299
Today Daily Change %-0.16
Today daily open19.2627
 
Trends
Daily SMA2019.3449
Daily SMA5018.6583
Daily SMA10018.2886
Daily SMA20017.9075
 
Levels
Previous Daily High19.5676
Previous Daily Low19.2211
Previous Weekly High19.9217
Previous Weekly Low19.4038
Previous Monthly High19.8684
Previous Monthly Low18.1703
Daily Fibonacci 38.2%19.3534
Daily Fibonacci 61.8%19.4352
Daily Pivot Point S119.1333
Daily Pivot Point S219.0039
Daily Pivot Point S318.7867
Daily Pivot Point R119.4799
Daily Pivot Point R219.697
Daily Pivot Point R319.8264

Author

Anil Panchal

Anil Panchal

FXStreet

Anil Panchal has nearly 15 years of experience in tracking financial markets. With a keen interest in macroeconomics, Anil aptly tracks global news/updates and stays well-informed about the global financial moves and their implications.

More from Anil Panchal
Share:

Markets move fast. We move first.

Orange Juice Newsletter brings you expert driven insights - not headlines. Every day on your inbox.

By subscribing you agree to our Terms and conditions.

Editor's Picks

EUR/USD consolidates below 1.1700 amid cautious markets

EUR/USD is holding steady below 1.1700 in the European trading hours on Thursday. The pair pauses its losing streak as the US Dollar consolidates the recent recovery amid a cautious market mood and ahead of the mid-tier US employment data. 

GBP/USD turns lower to near 1.3450 amid softer risk tone

GBP/USD loses ground to trade near 1.3450 in the early European session on Thursday. Markets turn cautious amid simmering geopolitical tensions and ahead of the US labor market data due later in the day. 

Gold sticks to intraday losses below $4,450; seems vulnerable to slide further

Gold maintains its offered tone through the first half of the European session and currently trades near the lower end of its daily range, down for the second straight day. The downfall lacks any obvious fundamental catalyst and could be attributed to some follow-through profit-taking ahead of the release of the US Nonfarm Payrolls report on Friday. 

Pi Network flashes bearish potential as selling pressure mounts

Pi Network trades above $0.2000 at press time on Thursday, following a nearly 2% decline the previous day. Centralized Exchanges have received 1.90 million PI tokens over the last 24 hours, suggesting risk-off sentiment among holders. The technical outlook for the PI token remains bearish, with a risk of a cross below the 20-day Exponential Moving Average. 

2026 economic outlook: Clear skies but don’t unfasten your seatbelts yet

Most years fade into the background as soon as a new one starts. Not 2025: a year of epochal shifts, in which the macroeconomy was the dog that did not bark. What to expect in 2026? The shocks of 2025 will not be undone, but neither will they be repeated.

Pi Network Price Forecast: PI flashes bearish potential as selling pressure mounts

Pi Network trades above $0.2000 at press time on Thursday, following a nearly 2% decline the previous day. Centralized Exchanges have received 1.90 million PI tokens over the last 24 hours, suggesting risk-off sentiment among holders.