USD/ZAR Price Analysis: Hesitates to justify rising wedge confirmation below 17.50
- USD/ZAR keeps the pullback moves from Friday’s top of 17.51.
- A verified bearish formation, sustained trading below 200-bar SMA favor the bears.
- Buyers need a successful break above 50% Fibonacci retracement for fresh entries.
USD/ZAR drop to 17.30, down 0.30% on a day during Tuesday’s Asian session. The pair recently confirmed a rising wedge bearish formation. However, the sellers seem to catch a breather around three-day low off-late.
The pair’s trading below 200-bar SMA offers extra strength to the sellers’ fraternity, in addition to the downbeat chart pattern.
As a result, June 04 high around 17.08 can act as immediate support for the pair ahead of the 17.00 round-figure. Though, the pair’s further weakness may dwindle around 16.75/70, if not then the odds of refreshing the monthly low near 16.30 can’t be ruled out.
Meanwhile, the support-turned-resistance and 200-bar SMA together offers a near-term important upside barrier around 17.55. Also restricting the quote’s immediate rise will be 50% Fibonacci retracement level of the pair’s fall from May 04 to June 10, at 17.65.
Should there be a clear rise past-17.65, the buyers might not hesitate to aim for the 18.00 threshold.
USD/ZAR hourly chart
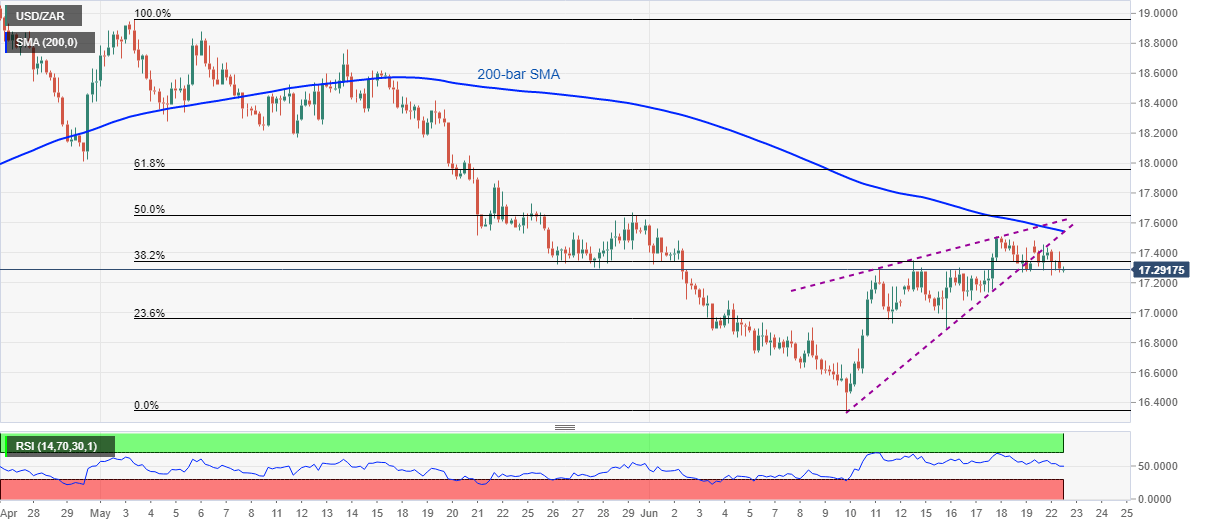
Trend: Bearish
Author

Anil Panchal
FXStreet
Anil Panchal has nearly 15 years of experience in tracking financial markets. With a keen interest in macroeconomics, Anil aptly tracks global news/updates and stays well-informed about the global financial moves and their implications.


