USD/ZAR Price Analysis: Clings to 100-day SMA between key trendlines
- USD/ZAR registers multiple bounces off 100-day SMA but stays below the support-turned-resistance trend line.
- An ascending trend line from January 01, 2020, offers additional support.
- The upside break of the immediate resistance line can aim for late-March low.
USD/ZAR takes rounds to 16.91 amid the Asian session on Friday. The pair’s recent moves have been confined between the 100-day SMA and a support-turned-resistance line stretched from April 30.
Even so, the bearish MACD signals increase the odds of the pair’s further downside past-100-day SMA. As a result, traders are looking towards the yearly support line, at 16.69 now, as a target past-16.89 immediate support.
If at all the USD/ZAR prices stay weak below 16.6, 50% Fibonacci retracement of January-April upside, near 16.62, could challenge the sellers.
On the upside, the pair’s break of the support-turned-resistance line, currently around 17.05, could escalate the pair’s recovery moves towards the late-March lows near 17.20. However, the May 29 top near 17.67 might restrict the pair’s further advances.
USD/ZAR daily chart
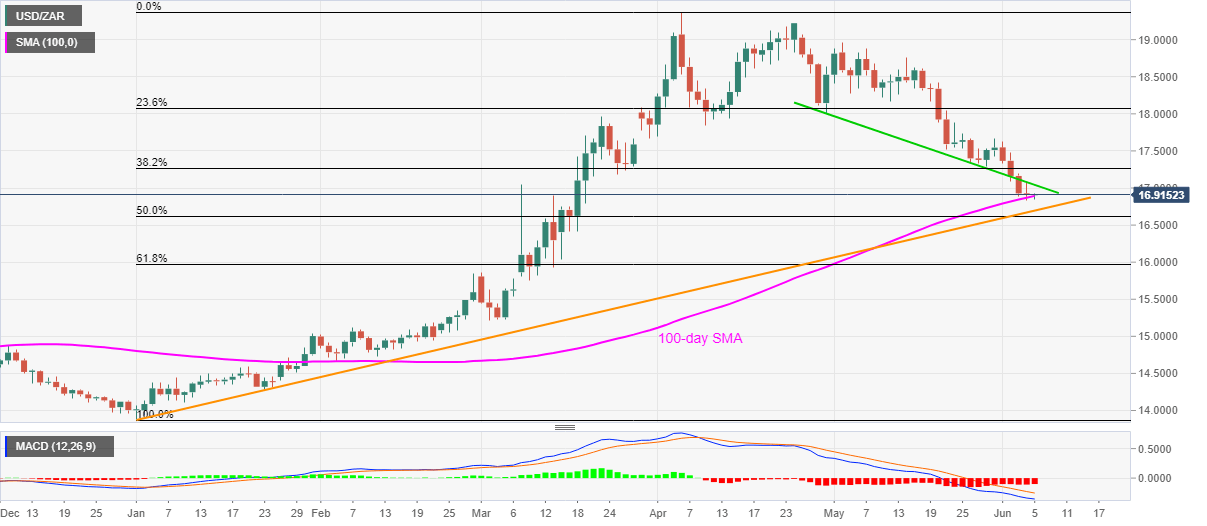
Trend: Sideways
Author

Anil Panchal
FXStreet
Anil Panchal has nearly 15 years of experience in tracking financial markets. With a keen interest in macroeconomics, Anil aptly tracks global news/updates and stays well-informed about the global financial moves and their implications.


