|

USD/ZAR Price Analysis: Bullish bias remains intact above $15.90

  • USD/ZAR stays mildly bid, keeps upside break of 200-HMA, short-term key resistance.
  • Firmer RSI line suggests continuation of recovery moves.
  • Fibonacci retracement signals intermediate stops before the multi-month high flashed in November.

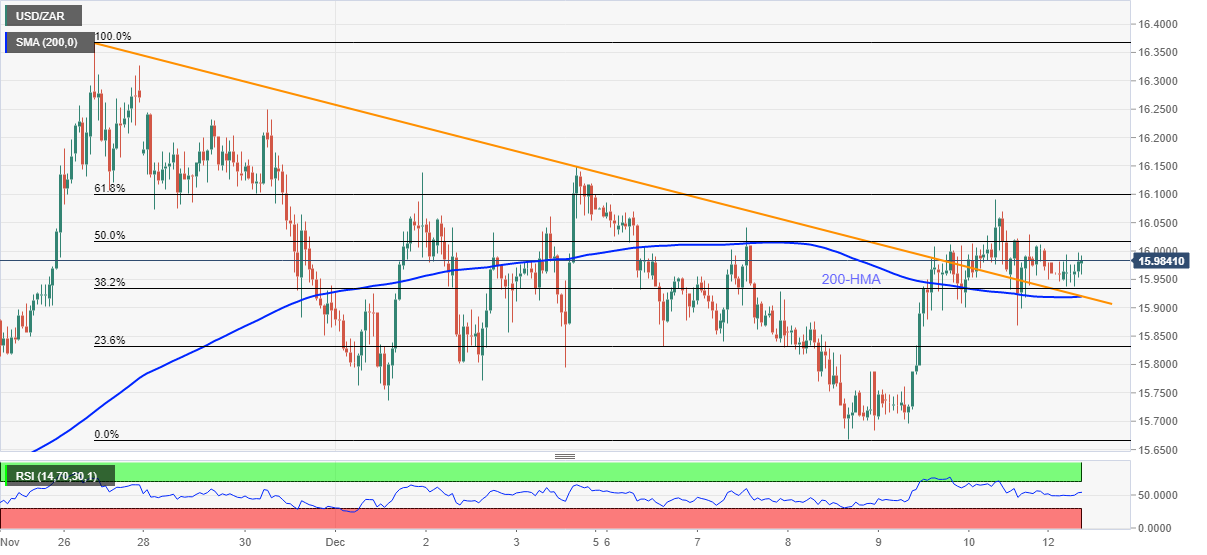
USD/ZAR pokes intraday high around $15.97, up 0.08% on a day heading into Monday’s European session.

The South African currency (ZAR) pair crossed a fortnight-old descending trend line, as well as the 200-HMA, the previous day but failed to cross the $16.10 hurdle of late.

Even so, the quote remains firmer past the stated key moving average and previous resistance line, around $15.90 by the press time. Given the steady RSI line favoring the latest rebound, the USD/ZAR can portray another attempt to cross the key Fibonacci retracement (Fibo.) levels of November 26 to December 08 declines.

Among them, the 50% and 61.8% Fibo. levels surrounding $16.00 and $16.10 are crucial before the quote can challenge November’s high of $16.36.

In a case where USD/ZAR bulls keep reins past $16.36, the mid-October peak close to $16.70 can offer an intermediate halt during the run-up to $17.00.

Meanwhile, a downside break of $15.90 support convergence will direct USD/ZAR bears towards the monthly low of $15.66.

However, the pair’s declines past $15.66 will be challenged by March 2021 tops near $15.58.

USD/ZAR: Hourly chart

Trend: Further upside expected

Additional important levels

Overview
Today last price15.981
Today Daily Change0.0074
Today Daily Change %0.05%
Today daily open15.9736
 
Trends
Daily SMA2015.8502
Daily SMA5015.3338
Daily SMA10015.0137
Daily SMA20014.6735
 
Levels
Previous Daily High16.0912
Previous Daily Low15.8696
Previous Weekly High16.1001
Previous Weekly Low15.6685
Previous Monthly High16.3684
Previous Monthly Low14.8632
Daily Fibonacci 38.2%16.0066
Daily Fibonacci 61.8%15.9543
Daily Pivot Point S115.865
Daily Pivot Point S215.7565
Daily Pivot Point S315.6433
Daily Pivot Point R116.0867
Daily Pivot Point R216.1998
Daily Pivot Point R316.3083

Author

Anil Panchal

Anil Panchal

FXStreet

Anil Panchal has nearly 15 years of experience in tracking financial markets. With a keen interest in macroeconomics, Anil aptly tracks global news/updates and stays well-informed about the global financial moves and their implications.

More from Anil Panchal
Share:

Markets move fast. We move first.

Orange Juice Newsletter brings you expert driven insights - not headlines. Every day on your inbox.

By subscribing you agree to our Terms and conditions.

Editor's Picks

EUR/USD remains below 1.1700 amid weakening momentum

EUR/USD remains steady after four days of losses, trading around 1.1680 during the Asian hours on Thursday. On the daily chart, the 14-day Relative Strength Index at 42.6 (neutral-bearish) indicates weakening momentum after slipping below the 50 midline. RSI staying sub-50 would keep bears engaged and limit recovery attempts.

GBP/USD consolidates above mid-1.3400s; bullish potential seems intact

The GBP/USD pair is seen consolidating its heavy losses registered over the past two days and oscillating in a narrow trading band, just above mid-1.3400s during the Asian session on Thursday. However, the fundamental backdrop warrants some caution for bearish traders and before positioning for an extension of the retracement slide from the 1.3565-1.3570 region, or the highest level since September 18, touched on Tuesday.

Gold: Deeper correction or dip-buying likely?

Gold is nursing losses near $4,450 in Asian trading on Thursday, having suffered about a 1% correction from weekly highs of $4,500 on Wednesday. All eyes remain on the geopolitical developments and the incoming US jobless claims data for fresh trading directives.

Top Crypto Losers: Pump.fun, Story, and Pudgy Penguins test key support levels

Pump.fun, Story, and Pudgy Penguins experience intense selling pressure over the last 24 hours. PUMP and IP failed to cross the 50-day Exponential Moving Average, resulting in a pullback on Wednesday, while PENGU is testing its 50-day EMA.

2026 economic outlook: Clear skies but don’t unfasten your seatbelts yet

Most years fade into the background as soon as a new one starts. Not 2025: a year of epochal shifts, in which the macroeconomy was the dog that did not bark. What to expect in 2026? The shocks of 2025 will not be undone, but neither will they be repeated.

XRP battles selling pressure as profit-taking, ETF inflows shape outlook

Ripple (XRP) is trading downward but holding support at $2.22 at the time of writing on Wednesday, as fear spreads across the cryptocurrency market, reversing gains made from the start of the year.