USD/TRY Price Analysis: Potential golden cross, bull pennant on 1H back further upside
- USD/TRY’s technical outlook appears constructive.
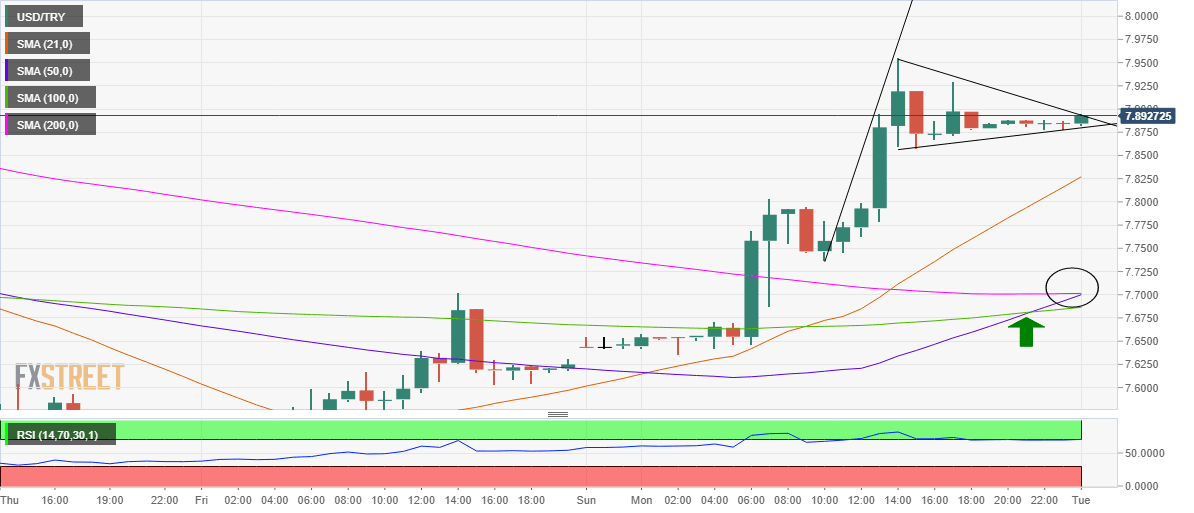
- Potential bull pennant, golden cross seen on the 1H chart.
- RSI flattens just below the overbought region, points to more gains.

USD/TRY holds the higher ground while trading just below the 8.0 level in Asia this Tuesday, as the bulls gear up for the next push higher.
Looking at the technicals, the hourly chart looks promising for the cross, as it on the verge of a bull pennant breakout as well as confirming a golden cross.
The 50-hourly moving averages (HMA) is seen cutting the 200-HMA from below, as of writing. A golden cross confirmation could add credence to the potential bull pennant breakout, opening doors for a test of 8.20 and beyond.
Also, signalling strength in the uptrend is the bullish crossover already confirmed, with the 50-HMA having pierced the 100-HMA from below late Monday.
The hourly Relative Strength Index (RSI) trades flat just below the overbought territory, suggesting that there is more room to the upside in the prices.
To the downside, the bullish 21-HMA at 7.83 is likely to offer strong support, below which the confluence of the 50 and 200-HMAs at 7.70 will be the level to beat for the bears.
USD/TRY: Hourly chart
Author

Dhwani Mehta
FXStreet
Residing in Mumbai (India), Dhwani is a Senior Analyst and Manager of the Asian session at FXStreet. She has over 10 years of experience in analyzing and covering the global financial markets, with specialization in Forex and commodities markets.


