USD/RUB Price Analysis: Eyes further losses on break of five-week-old support
- USD/RUB consolidates recent losses around weekly low, remains below the key support trend line.
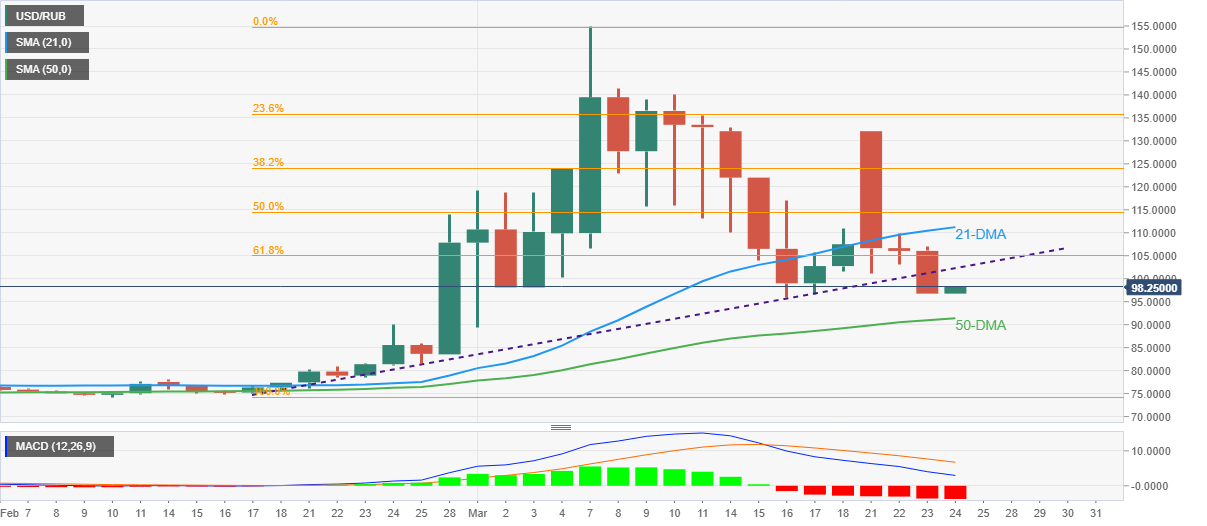
- Bearish MACD, trend line break directs bears towards 50-DMA.
- 21-DMA, 61.8% Fibonacci retracement level restrict recovery moves.

USD/RUB consolidates weekly losses around 98.25, up 1.55% intraday during Thursday’s Asian session.
The Russian ruble pair dropped to the lowest in one week after breaking an ascending trend line from mid-February.
As the trend line breakdown joins bearish MACD signals, the USD/RUB prices are likely to fade the latest corrective pullback.
Hence, the 50-DMA surrounding 91.40 and the 90.00 threshold gain the seller’s attention ahead of the last monthly bottom near 75.00.
Alternatively, further recovery needs to cross the previous support line, close to 102.15 at the latest, to convince buyers.
Even so, 61.8% Fibonacci retracement level of February-march upside, around 105.00, will precede the 21-DMA figures close to 111.25 to challenge the USD/RUB bulls.
USD/RUB: Daily chart
Trend: Further weakness expected
Author

Anil Panchal
FXStreet
Anil Panchal has nearly 15 years of experience in tracking financial markets. With a keen interest in macroeconomics, Anil aptly tracks global news/updates and stays well-informed about the global financial moves and their implications.


